
Welcome to the ECG247 portal
This guide shows how to use the ECG247 portal in clinical work. You can follow it from start to finish: create a patient, start a test, review the recording and create a report. You can also use it to look up a specific function.
You log in at www.ecg247.com.
How to use this guide
- Numbered points: Click a point in the screenshot to see what the button or field does. The explanations are also listed below the image.
- Try it: In some sections you can try the functions directly, for example scrolling through the ECG, display options, the measuring tool and the heart rate graph.
- Step by step: The most common tasks are described step by step.
- Search: Use the search field in the menu to find a function.
- The logo: Wherever you are in the portal, you can return to the patient list by clicking the ECG247 logo in the top left corner.
All screenshots show fictitious demo data. No information comes from real patients.
Contents
1. Patient list
The patient list is the start page of the portal. Here you see all patients in the organization and the status of the latest test for each of them.
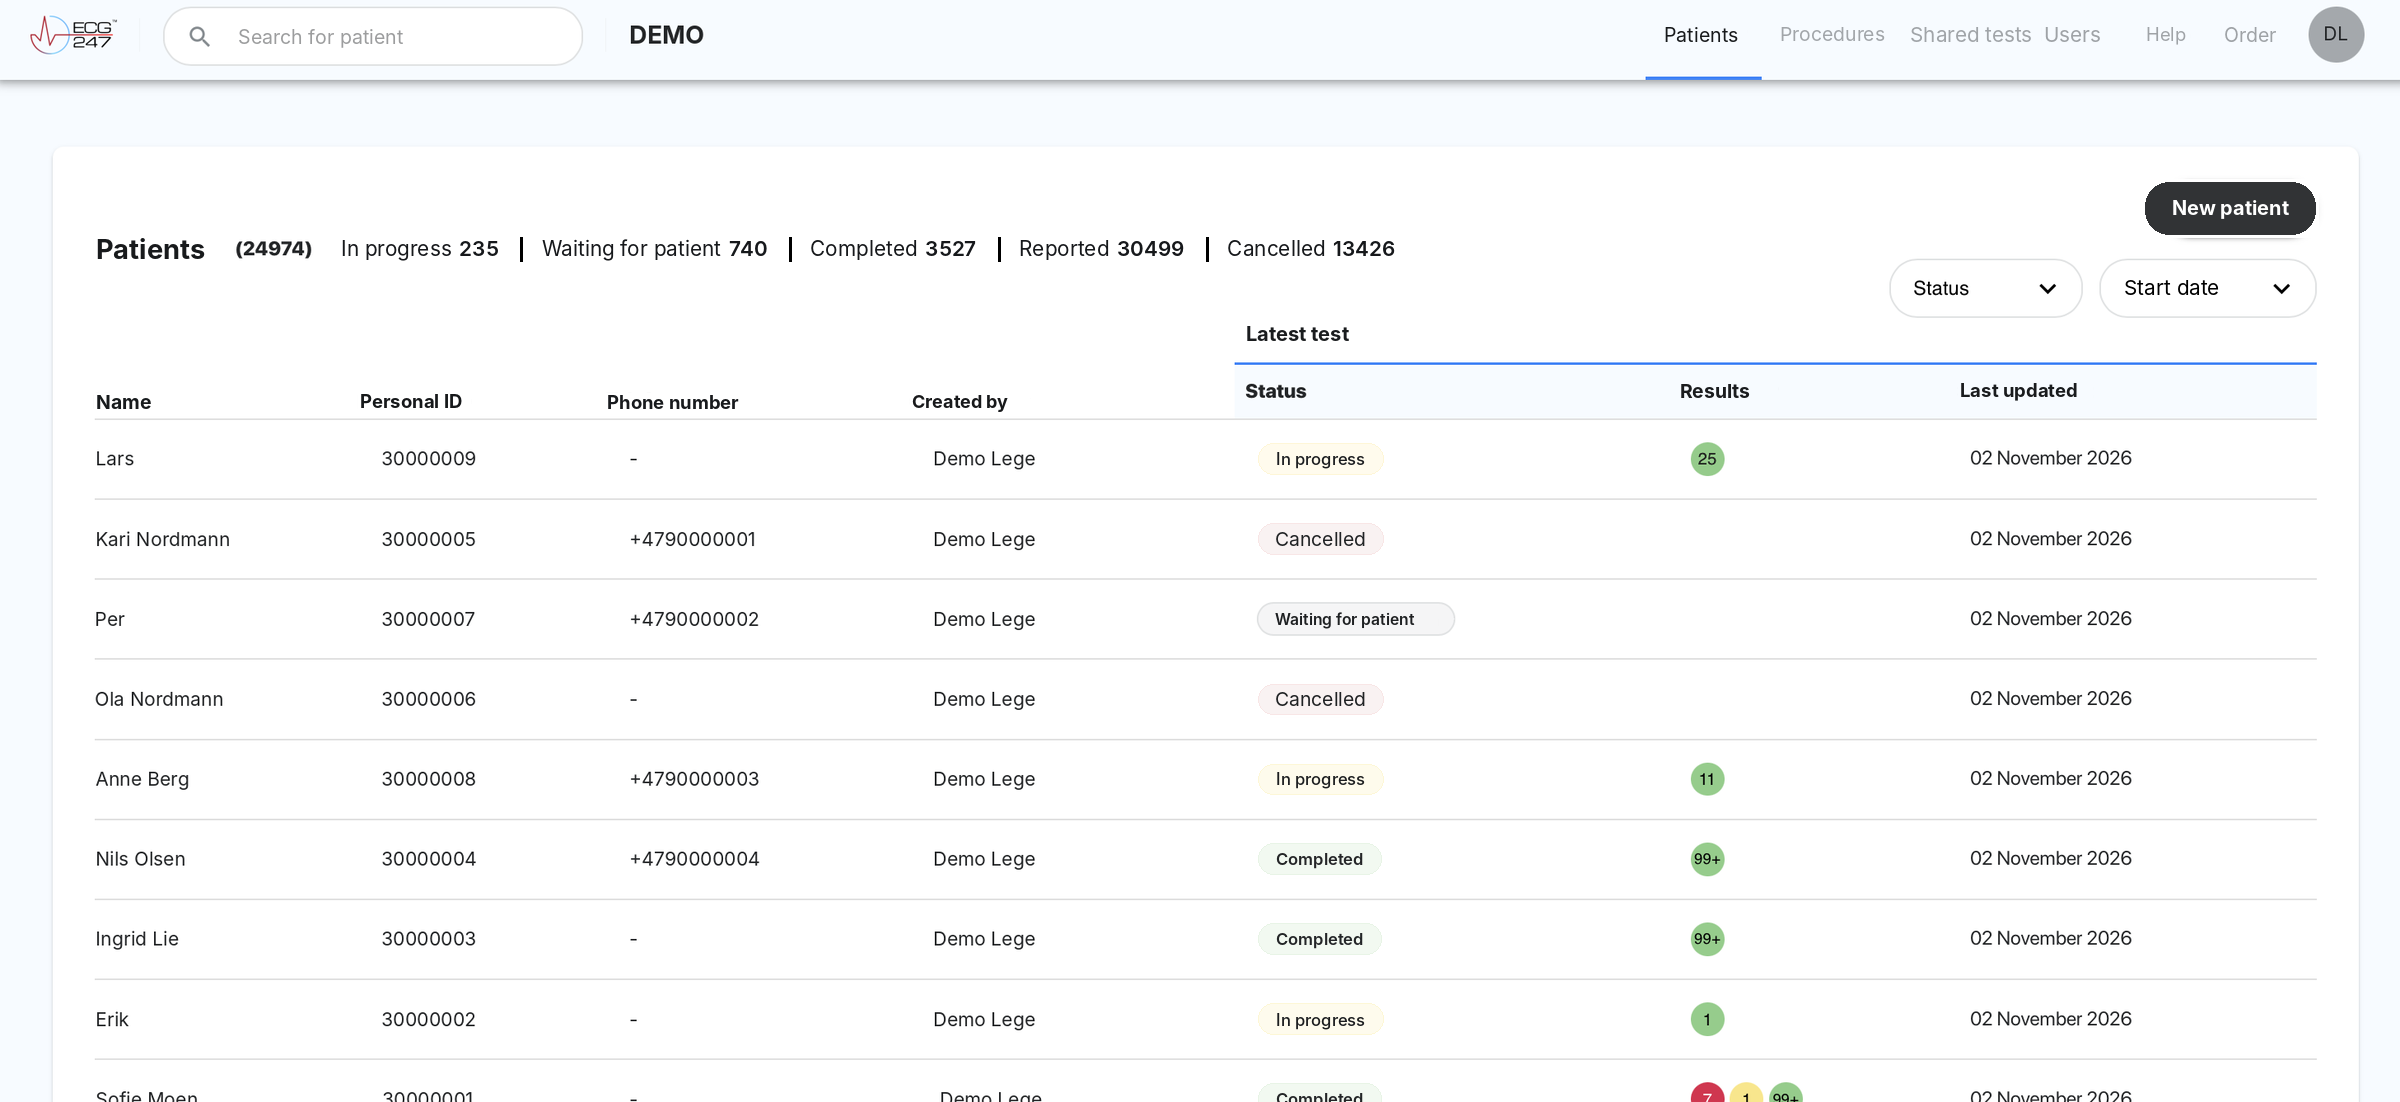
- 1
ECG247 logo
Click the logo in the top left corner to return to the patient list. This works from every page in the portal. - 2
Search for patient
Search by name, personal ID or phone number. - 3
Organization
Shows which organization you are logged in to. - 4
Main menu
Patients shows one row per patient, with the status of the latest test. Procedures shows all tests, one row per test. Shared tests shows tests from other organizations that you have been given access to with a sharing code. Under Users you add and manage health personnel in the organization. Help opens this guide. Order goes to the order page for electrode patches and sensors. - 5
Status overview
Shows how many patients have each status. The numbers are for overview only. To filter the list, use the filters on the right. - 6
New patient
Register a new patient. See New patient. - 7
Status and Start date
Drop-down menus that filter the list by test status or by the date the test started. - 8
Status of latest test
Waiting for patient: The test has been created, but the patient has not started the recording. In progress: The recording is running. Completed: The recording has ended and is ready for review. Reported: A PDF report has been created. A report can also be created while the test is in progress, and if the report is deleted, the status returns to In progress or Completed. Cancelled: The test was cancelled manually, or automatically because the patient did not start within the time limit set by the organization. - 9
Results
Shows arrhythmia findings, colour-coded by severity. The number is the number of ECG files in the category. Red: longer VT, longer SVT and pauses. Orange: atrial fibrillation and atrial flutter. Yellow: short VT and SVT runs. Green: normal sinus rhythm. - 10
Patient row
Click a patient to open the patient page.
2. New patient
Click New patient in the top right corner of the patient list. Only Personal ID and Name are required. Everything else is optional. You start the test afterwards, see Start a test.
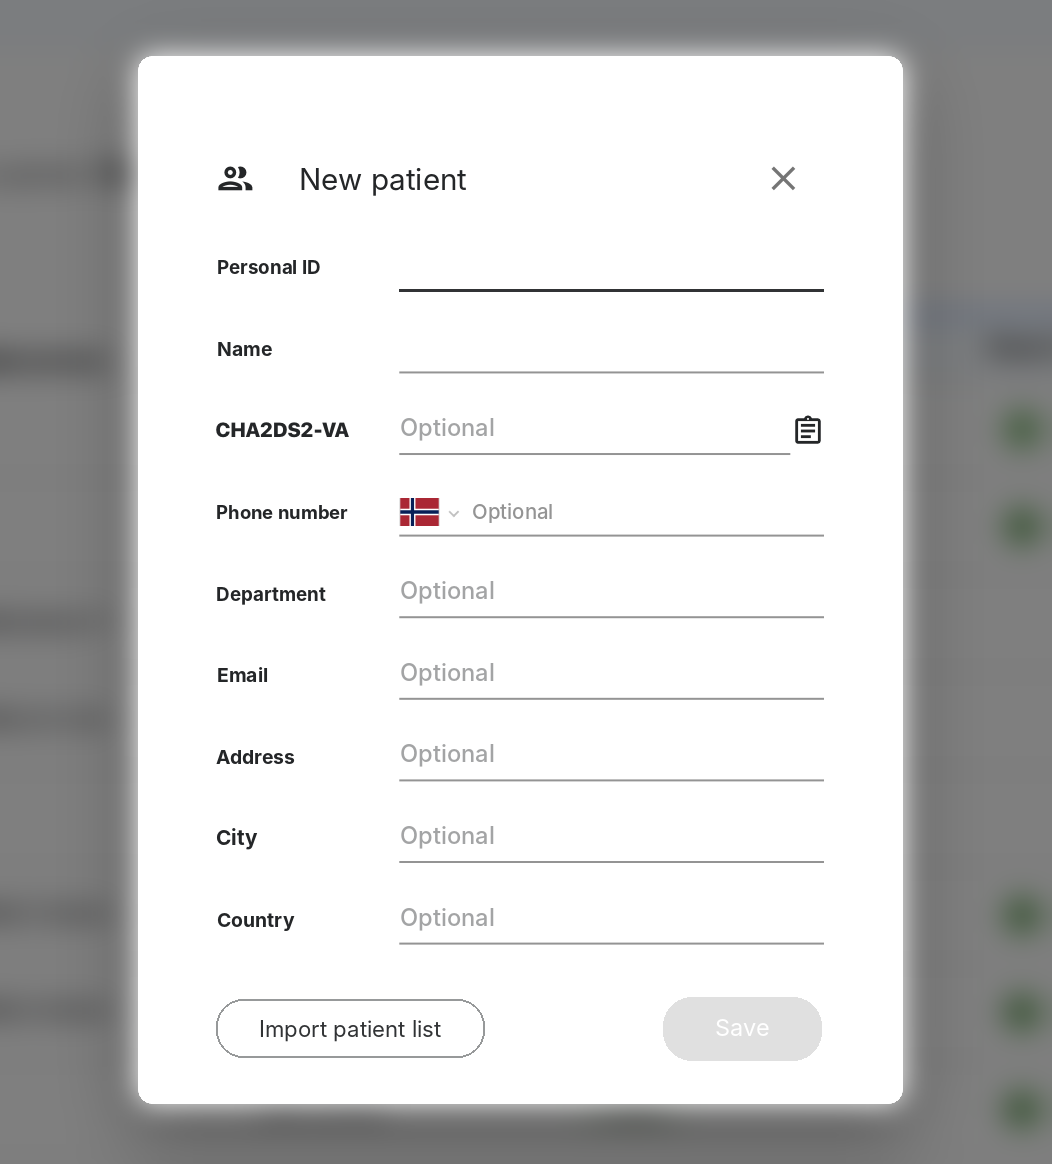
- 1
Personal ID (required)
Choose what to use. Most often it is the national identity number, but it can also be a random patient number or a study number. - 2
Name (required)
The patient's name. - 3
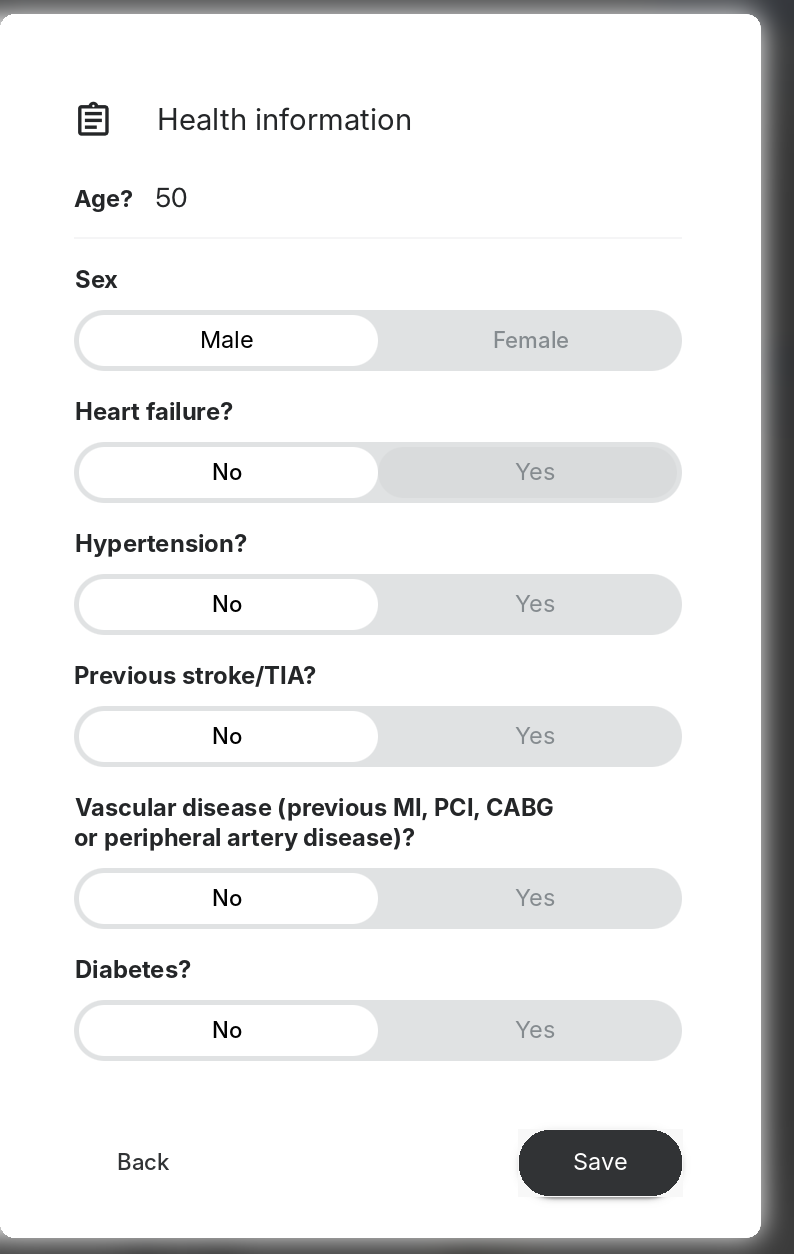
CHA2DS2-VA (optional)
Click the icon to open Health information. Enter age and sex, and answer yes or no for heart failure, hypertension, previous stroke/TIA, vascular disease and diabetes. When you click Save, the score is calculated automatically and entered in the field.
- 4
Phone number (optional)
Choose the country code with the flag. The number is used when you send the patient the start link by SMS. - 5
Department (optional)
Shows which department the patient belongs to, for example cardiology, paediatrics or neurology. The list cannot be sorted by this field. - 6
Email, address, city and country (optional)
Other contact details for the patient. - 7
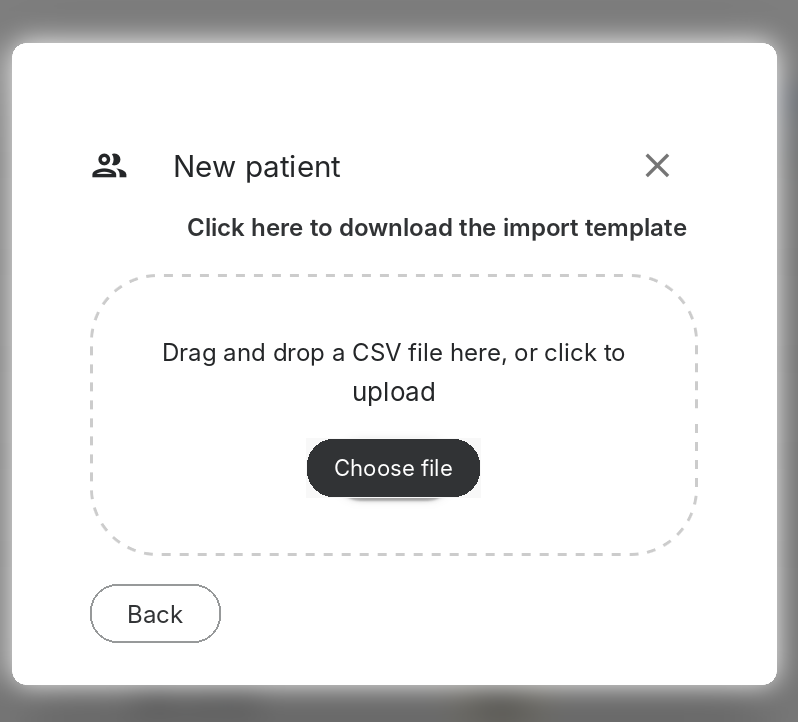
Import patient list
Register many patients at once from a CSV file. Download the import template, fill it in and drag the file into the field, or click Choose file. - 8
Save
Creates the patient. The button becomes active when Personal ID and Name have been filled in. - 9
Close (X)
Closes the form without saving.
3. Patient page and Start a test
When you have created the patient, click the patient in the patient list to open the patient page. Here you see the patient details and previous tests, and this is where you start a new test.
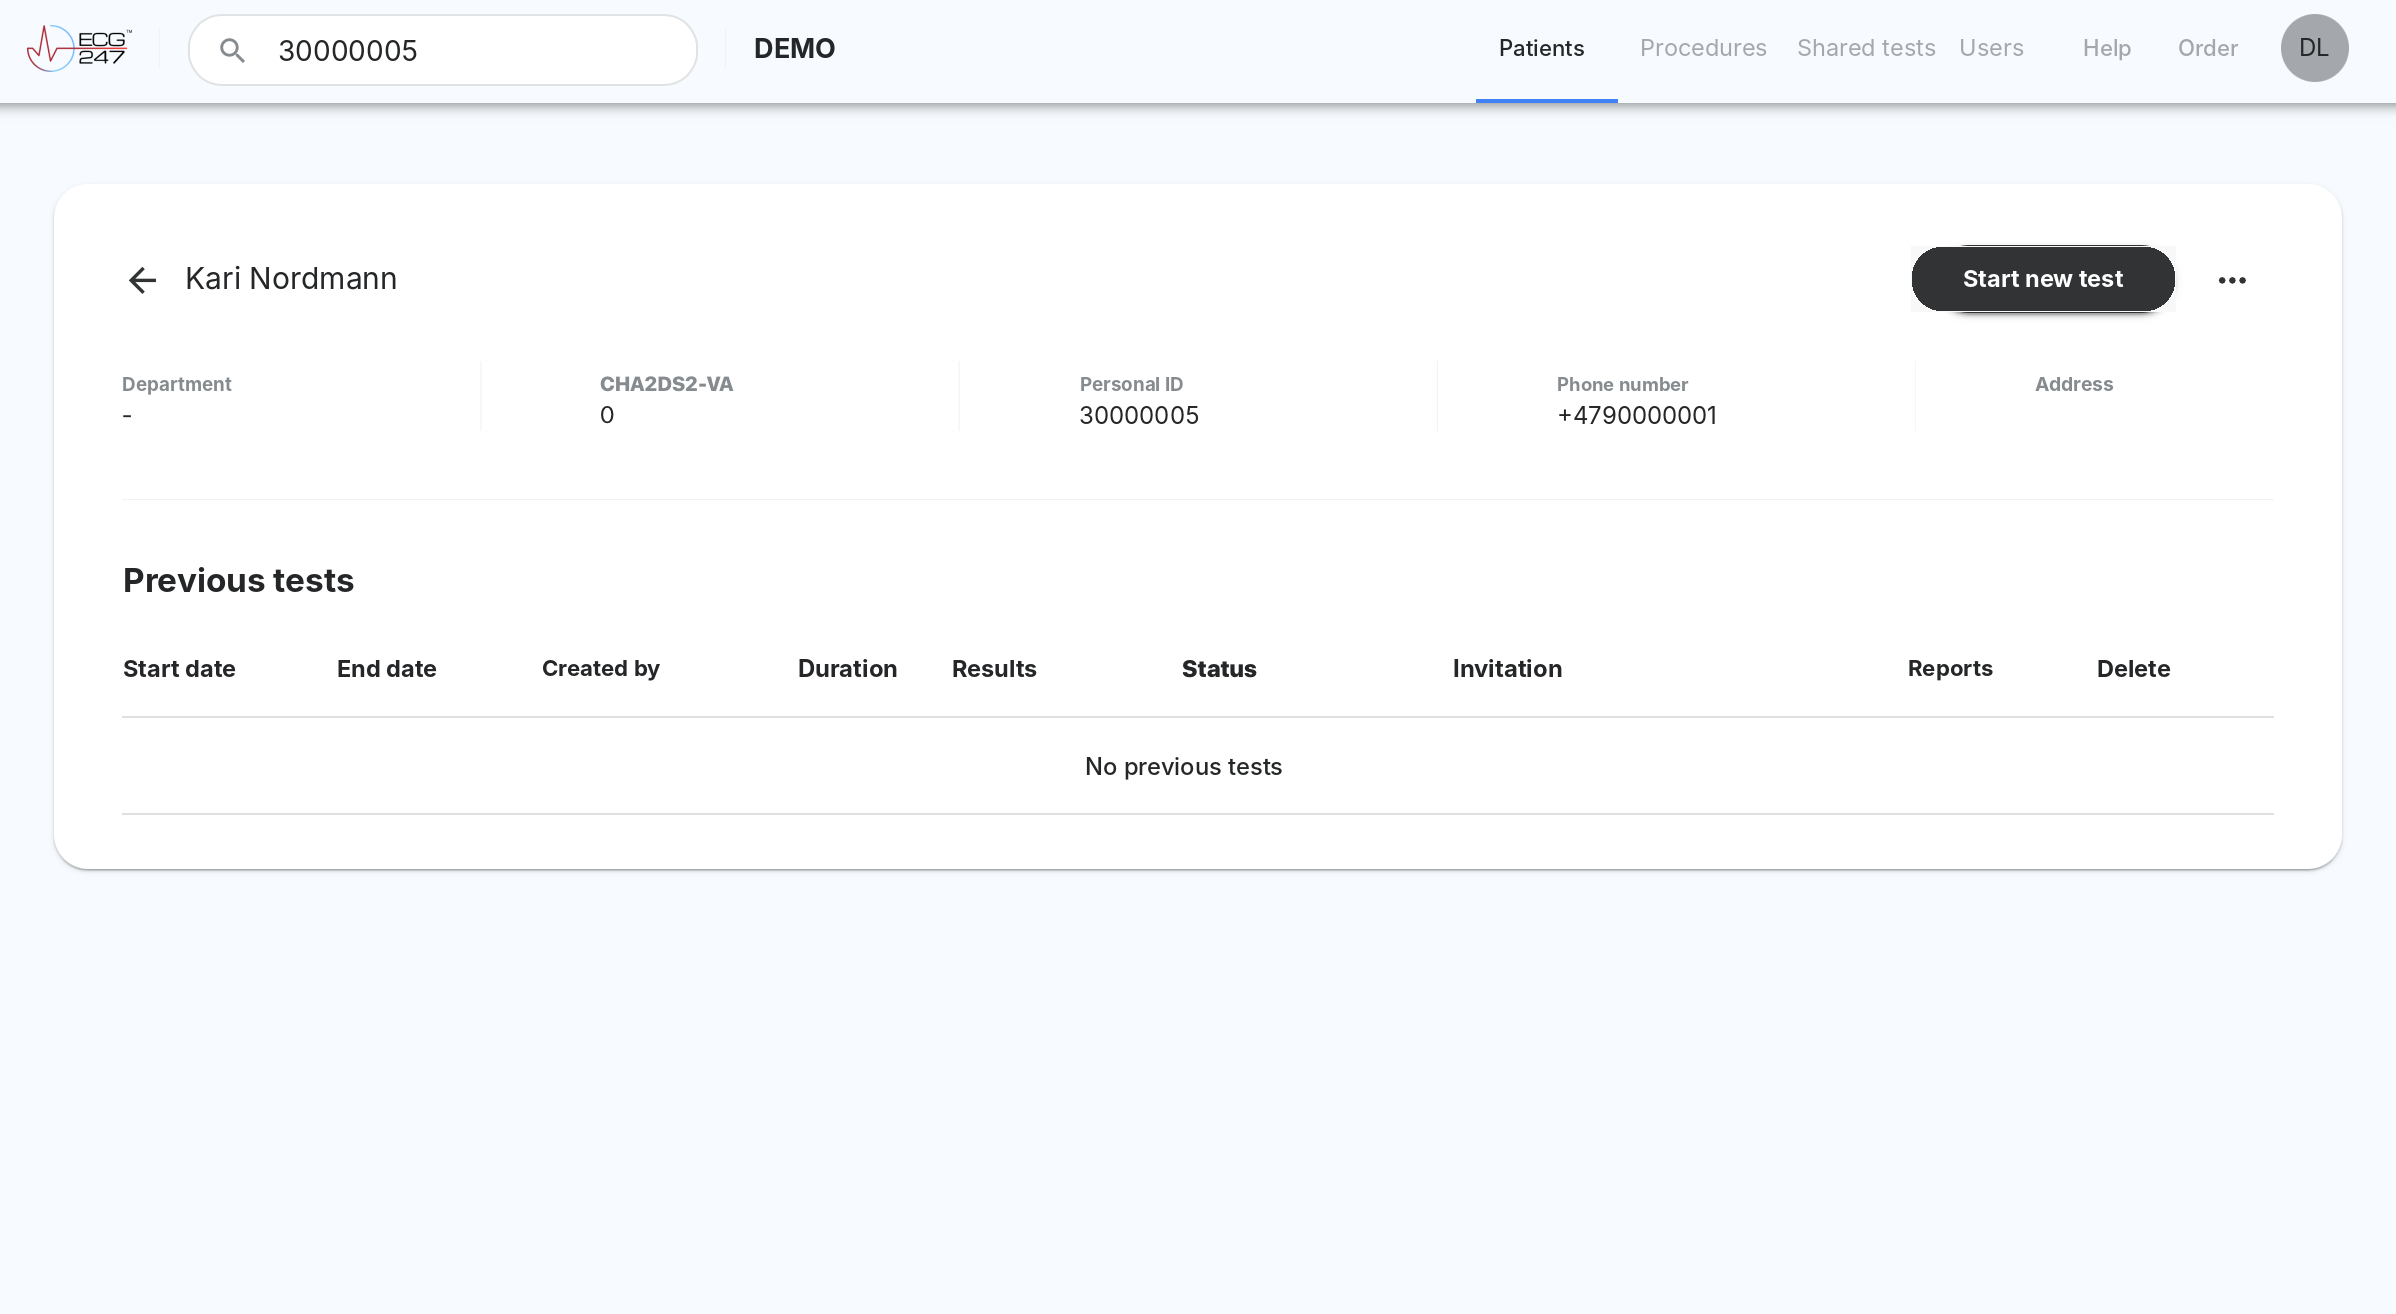
- 1
Back arrow and patient name
The arrow takes you back to the patient list. - 2
Start new test
Opens the Start new test dialog (see below). - 3
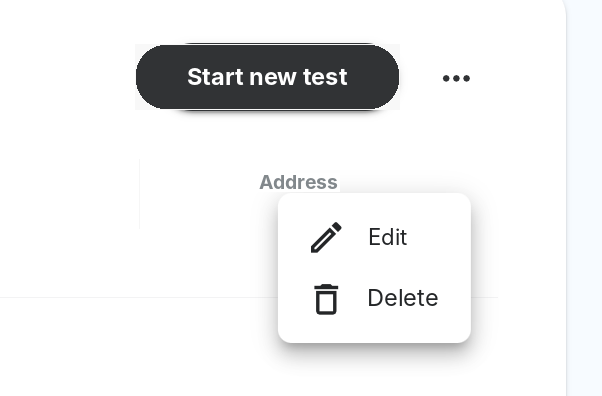
Menu (…)
Edit: change the patient details. Delete: delete the patient. - 4
Patient details
Department, CHA2DS2-VA, personal ID, phone number and address, as entered under New patient. - 5
Previous tests
The patient's tests, one row per test. A new patient has no tests yet.
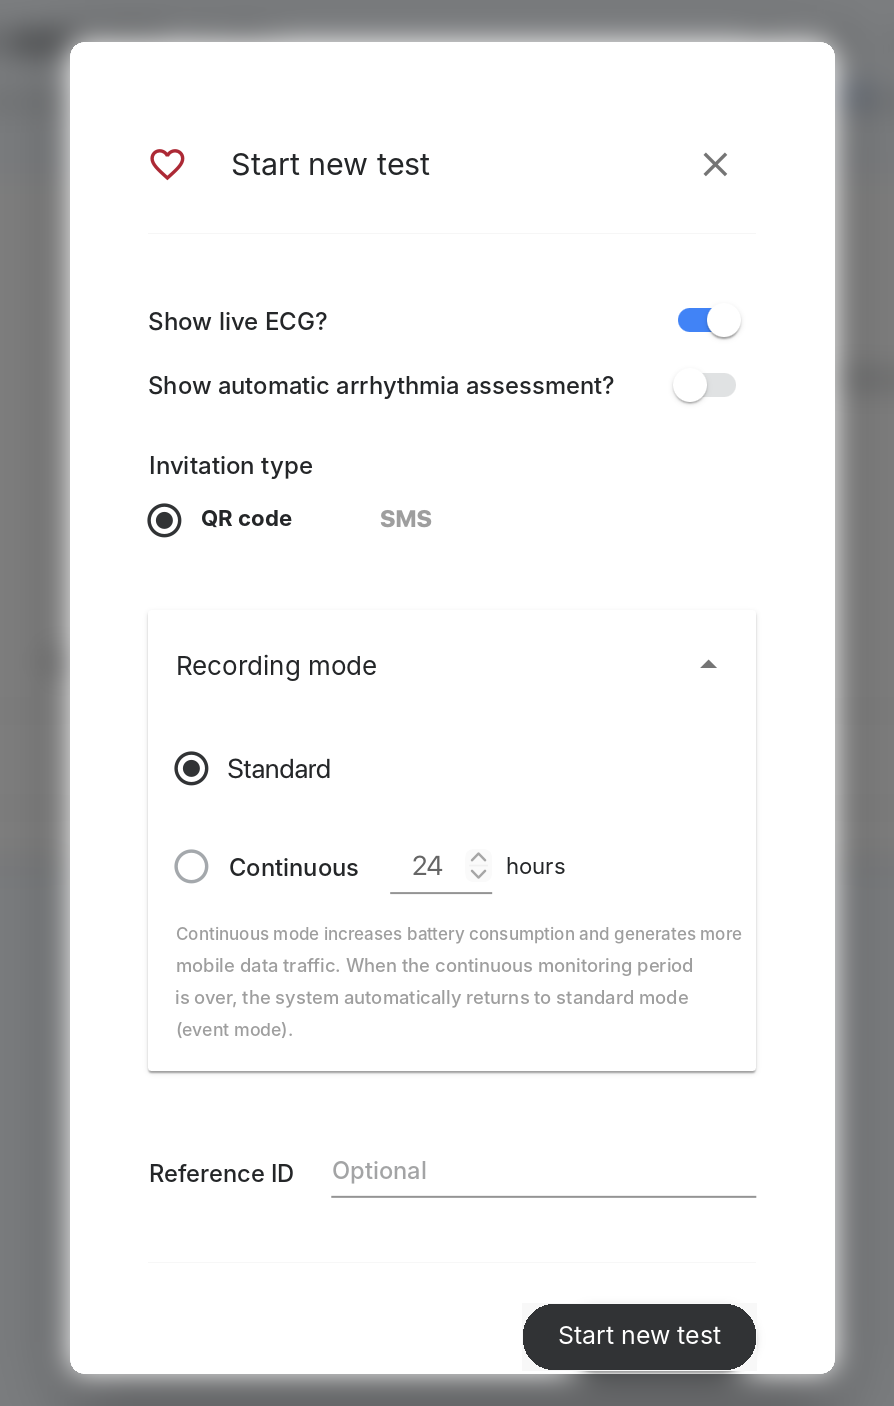
- 6
Show live ECG?
Determines whether the patient sees the live ECG in the ECG247 app. - 7
Show automatic arrhythmia assessment?
Determines whether the patient sees the automatic arrhythmia assessment in the app. - 8
Invitation type
QR code: The patient scans the code with the ECG247 app. SMS: The start link is sent to the phone number registered for the patient. - 9
Recording mode
Standard (event mode): stores all arrhythmias, all ectopic beats, manual recordings and 1 minute of ECG every hour. Continuous: stores all ECG for the number of hours you choose (24 is preselected). This uses more battery and more mobile data. When the period is over, the system automatically returns to standard mode. - 10
Reference ID (optional)
Used for integration with other electronic health record systems (EHR). - 11
Start new test
Creates the test and sends the invitation.
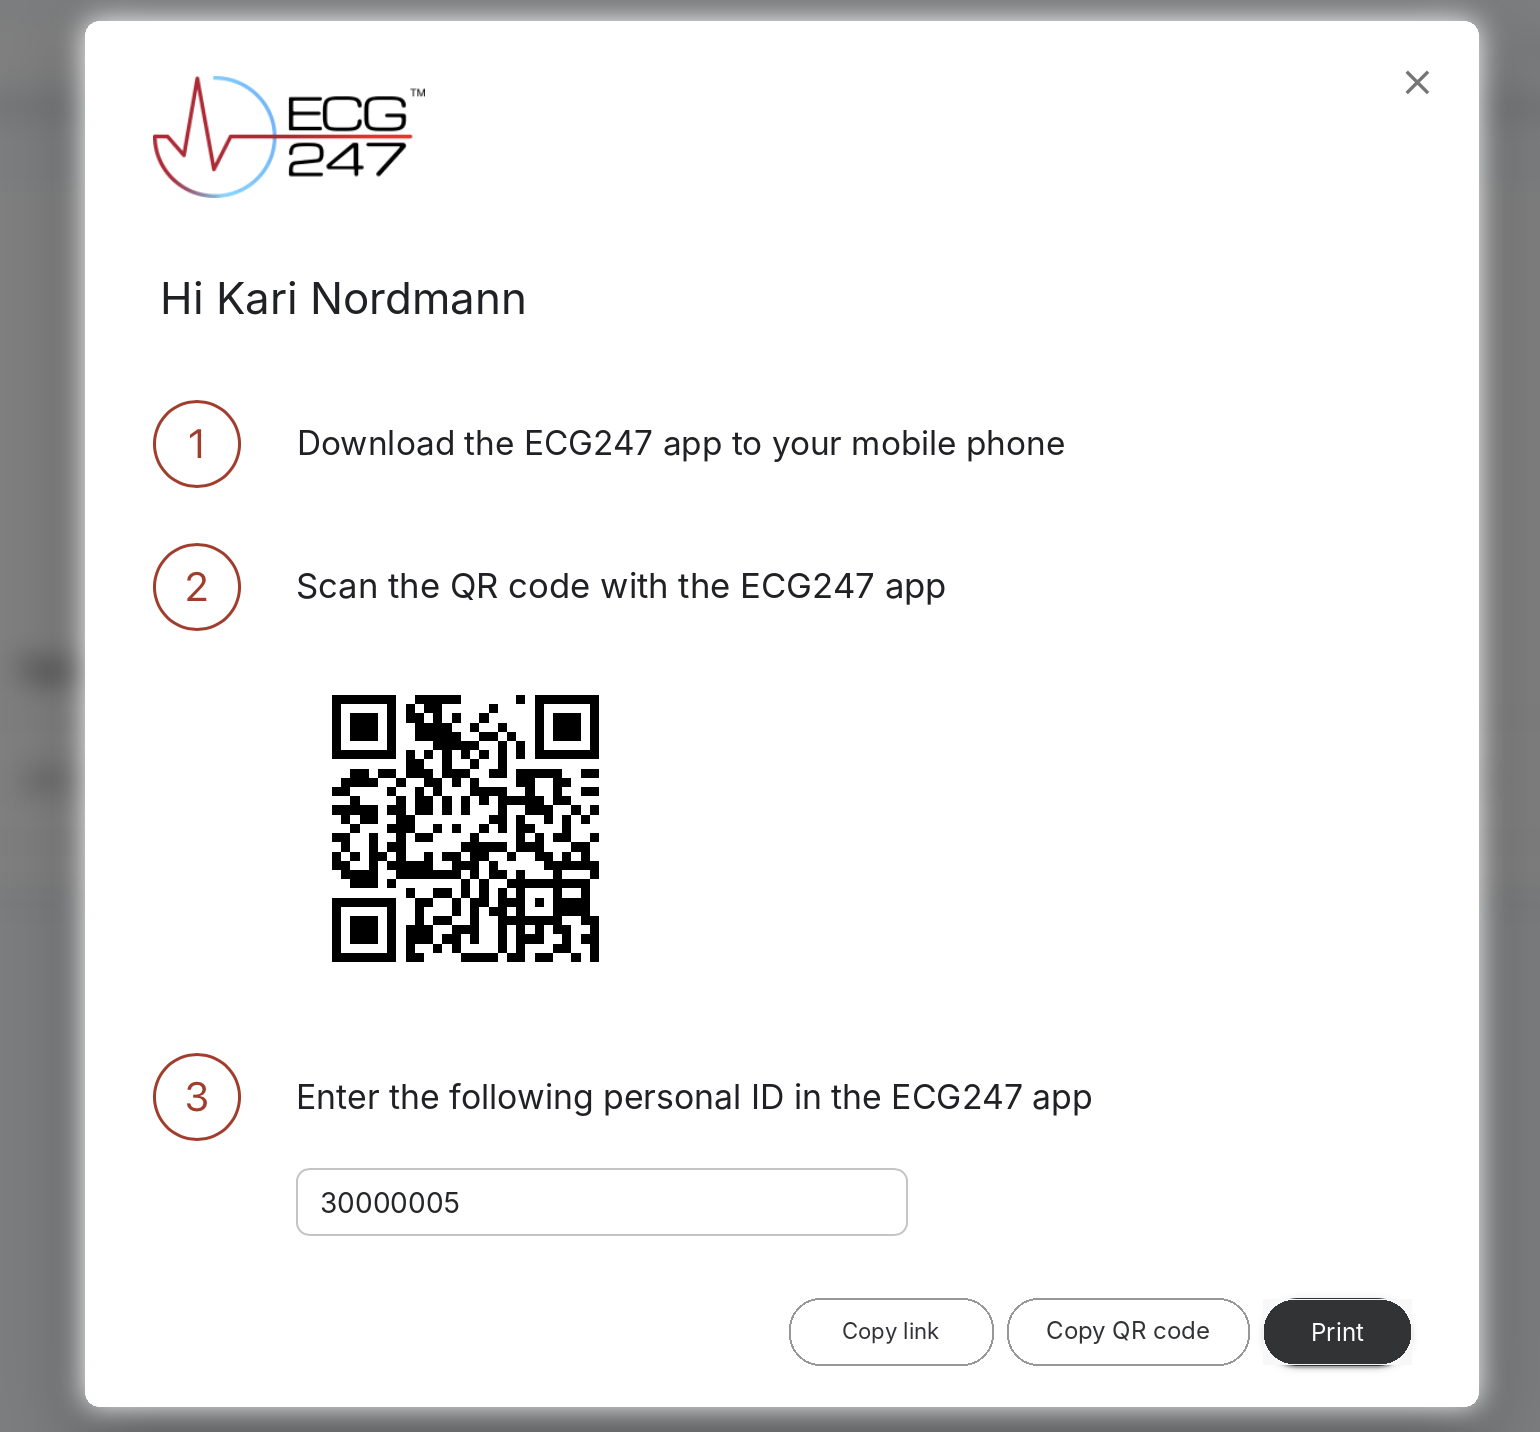
- 12
Copy link
Copies the start link, so you can send it to the patient in another way. - 13
Copy QR code
Copies the QR code as an image. - 14
Print
Prints the invitation, so the patient can take it home. The organization can have its own logo shown next to the ECG247 logo.
- 15
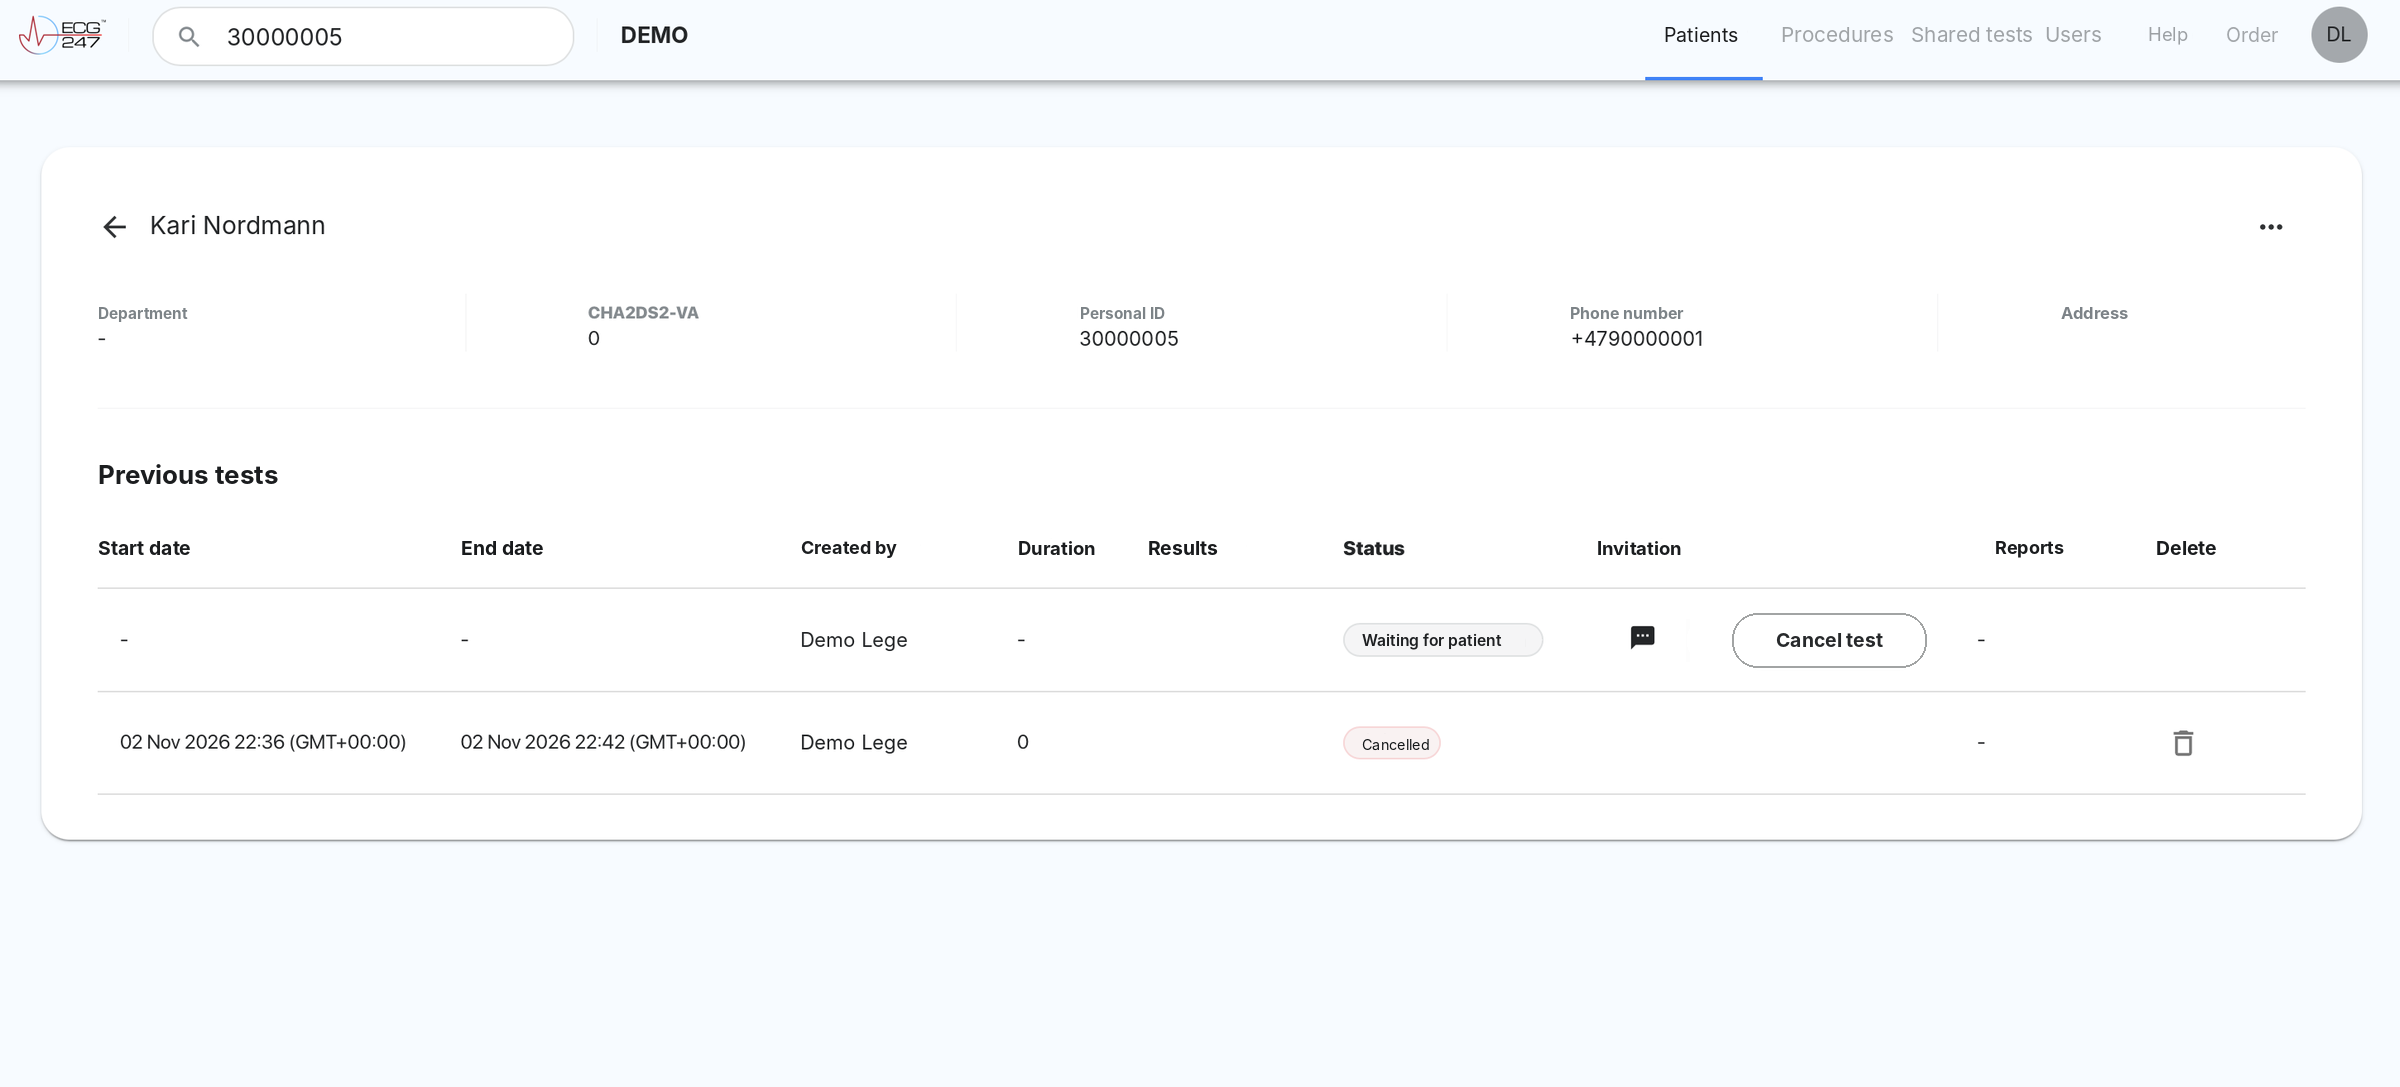
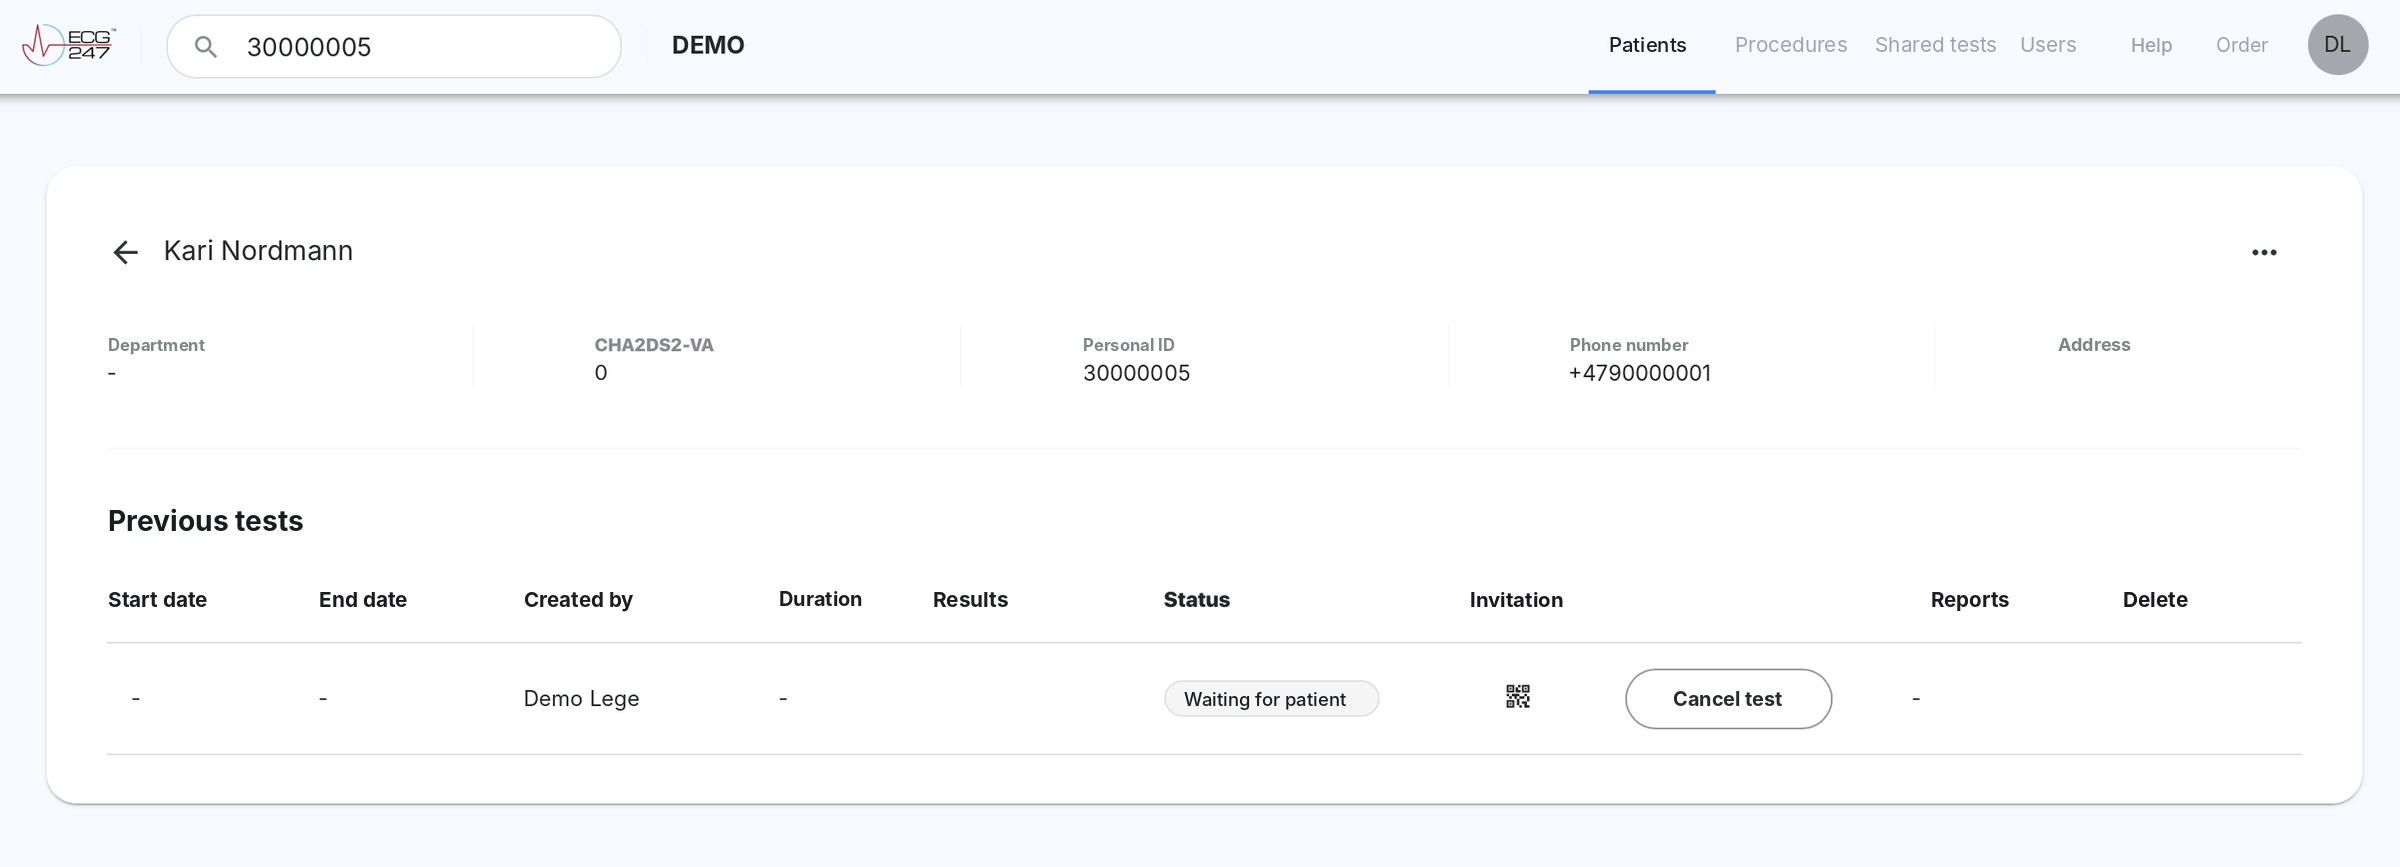
Status “Waiting for patient”
The test has been created, but the patient has not started the recording. - 16
Invitation
The icon shows how the test was started. QR icon: opens the invitation again, so the patient can scan it directly or you can print it. SMS icon: the start link was sent by SMS. The SMS cannot be resent. If the patient has not received the link, cancel the test and start a new one. - 17
Cancel test
Cancels the test before the patient has started. The test is also cancelled automatically when the time limit set by the organization has passed. - 18
Cancelled
A cancelled test. - 19
Delete (bin)
Deletes the test, whatever its status.Deletion cannot be undone. All ECG data for the test are deleted.
Step by step: Start a test
- Open the patient from the patient list.
- Click Start new test.
- Choose settings, recording mode and invitation type, and click Start new test.
- QR code: Let the patient scan the code with the ECG247 app, or print the invitation. SMS: The patient receives the start link on their phone.
- The patient follows the instructions in the app: attaches the sensor to the electrode patch, connects the sensor to the phone, attaches the patch to the chest and starts the test.
- When the recording is running, the status changes from Waiting for patient to In progress.
4. Summary
When you open a test, you first come to Summary. Here you see the automatic analysis of the whole recording: heart rhythm, heartbeats and heart rate. The summary is ECG247's automatic interpretation and cannot be edited manually. You review the ECG itself in the ECG tab.

- 1
Back arrow and patient name
The arrow takes you back to the patient list. You can also click the ECG247 logo. - 2
Test information
Duration: the time from when the test was started until it was stopped, even if the patch was removed earlier. Analysed time: the time from the first to the last ECG. Interpretable share: how much of the analysed time has interpretable ECG quality. Phone model and operating system: refer to the phone the patient used. - 3
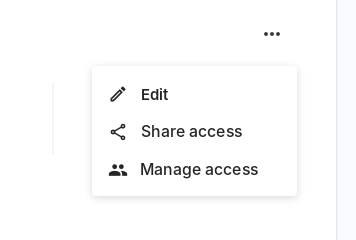
Menu (…)
Edit: change details about the patient or the test. Share access: create a sharing code, so health personnel in another organization can review the test under Shared tests. Manage access: see who the test is shared with, and withdraw access. - 4
Tabs
Summary, ECG, Heart rate, Create PDF report and Download PDF report. - 5
Heart rhythm
Time in each rhythm category, with duration and share. The colour codes are the same as in the patient list. For tachyarrhythmias, the average, lowest and highest rate are also shown. - 6
Manual recordings
Recordings the patient started themselves, with the button on the sensor or in the ECG247 app. For each recording, ECG from 30 seconds before to 30 seconds after the recording was started is stored. In the app, the patient can also write a comment, for example about symptoms. You find the recordings and comments in the ECG tab. - 7
Heartbeats
Number of VES, SVES and normal beats, total number of beats, and the share of each type. - 8
Heart rate
Average for the whole recording, and for day (06–22) and night (22–06). Lowest and highest heart rate (median per minute) with time, and average 1-minute HRV.
5. ECG tab
In the ECG tab you see the ECG recordings themselves, sorted by finding. Here you go through the arrhythmias found by the automatic analysis and choose which ECG strips to include in the PDF report. The categories are the automatic interpretation and cannot be changed here. Misclassified beats can still be corrected for the PDF report with Beat morphology groups.

- 1
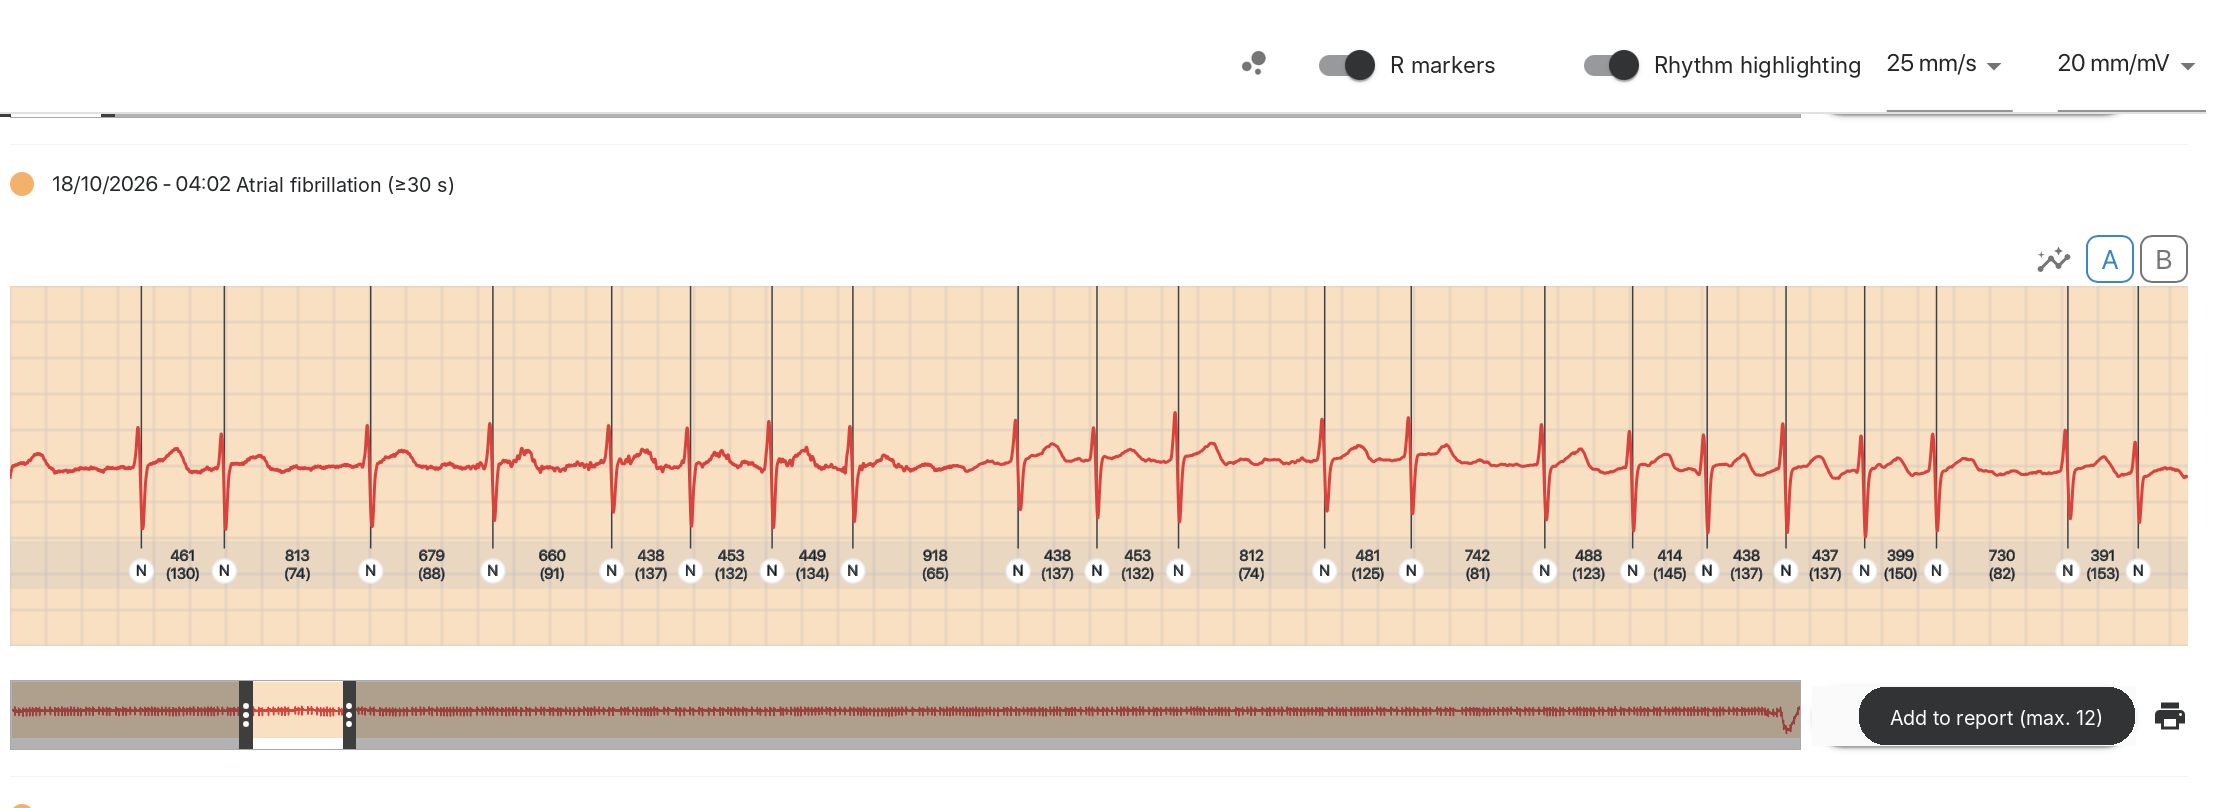
Categories
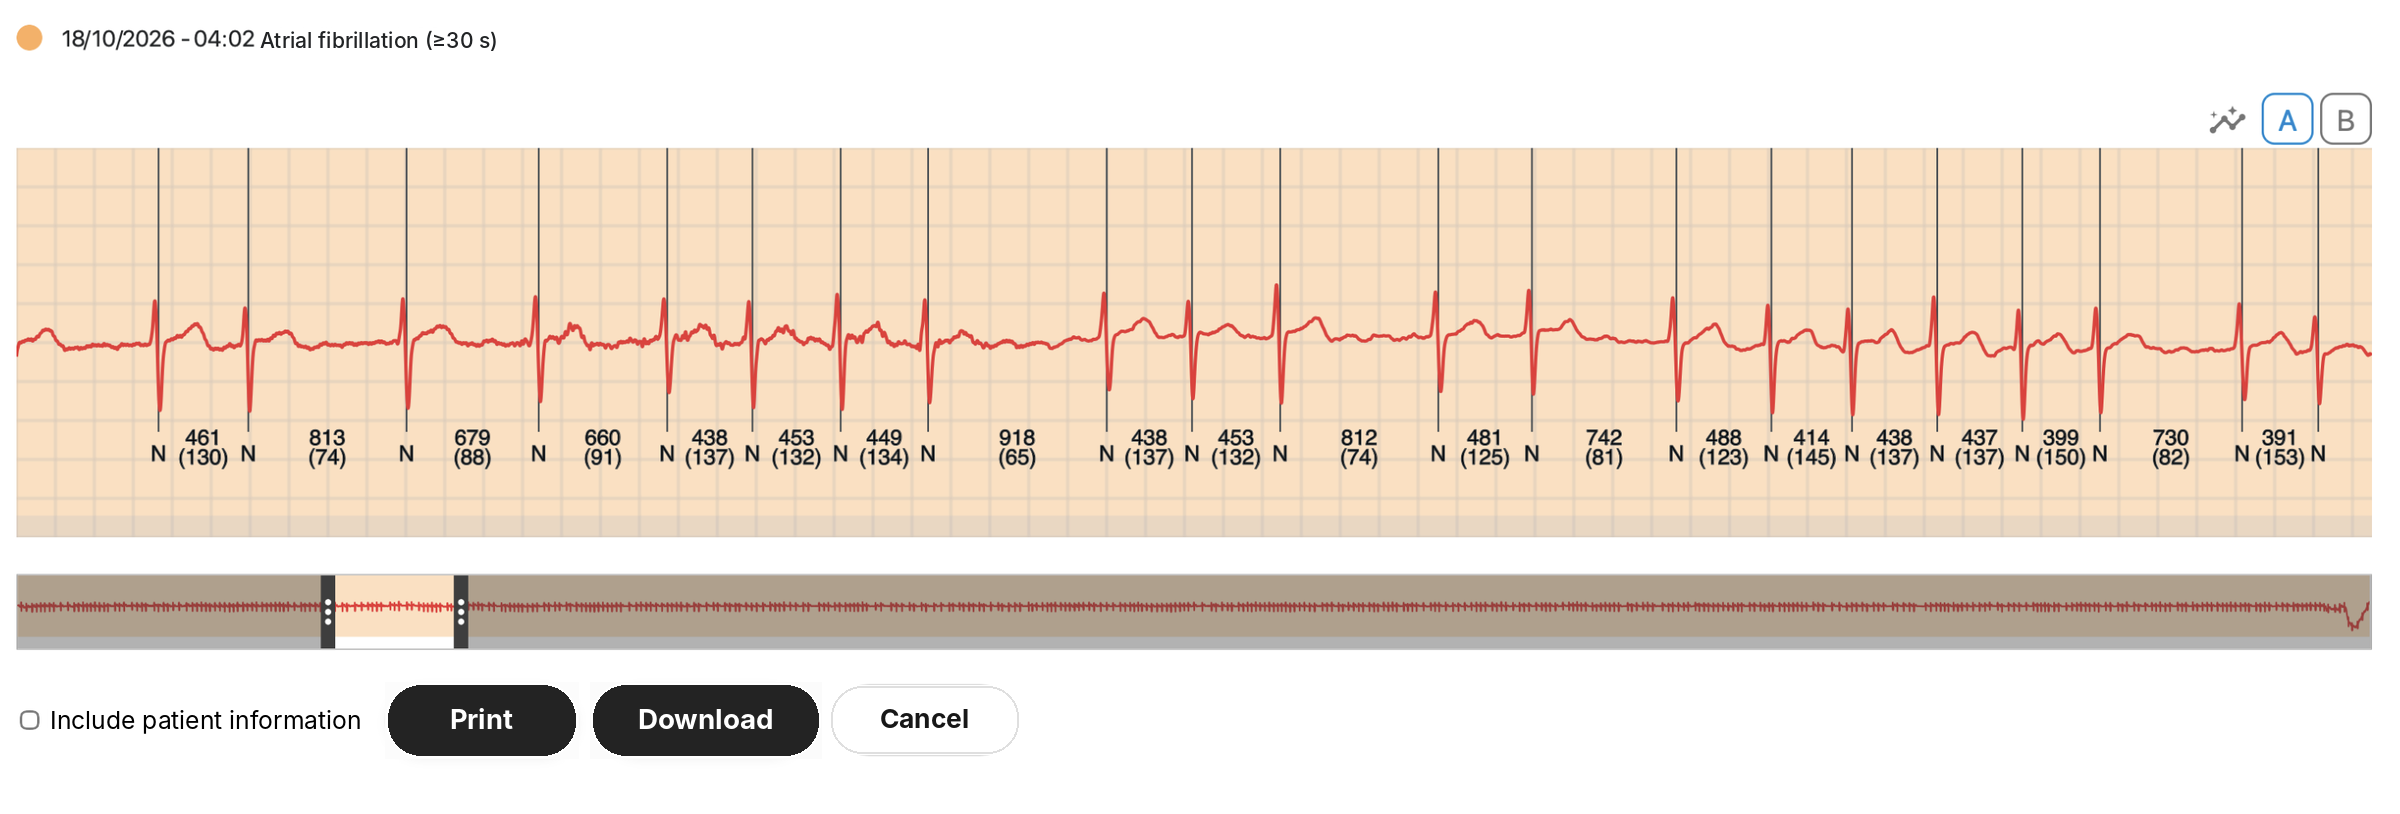
The findings are grouped by rhythm and beat type, with the same colour codes as in the patient list. Under each category is the number of ECG recordings. Click a category to see the recordings. Manual recordings: If the patient has written a comment in the app, it is shown below the ECG strip. Periodic recording: 1 minute of ECG every hour in standard mode. - 2
Beat morphology groups (icon with dots)
Opens beat morphology groups. There the beats are collected in groups with the same QRS morphology, and you can reclassify whole groups. See Beat morphology groups. - 3
R markers
Marks each QRS complex with the beat type (N = normal beat). Between the beats, the RR interval in ms and the heart rate in brackets are shown, for example 461 (130). - 4
Rhythm highlighting
Colours the background by rhythm category, for example orange for atrial fibrillation. - 5
Paper speed and gain
Choose 25 or 50 mm/s, and 10, 20 or 50 mm/mV. - 6
Heading
Date, time and category of the recording. - 7
Baseline filter (icon with graph and sparkle)
Straightens the ECG when there is marked baseline wander. - 8
A / B
Switches between the two channels (leads). - 9
Measuring tool
Click in the ECG and drag to measure a time interval. You get the duration in ms, the number of beats and the average heart rate. The beats within the measurement get R markers with RR intervals. Drag the middle of the measurement to move it, or drag one of the edges to resize it. Click outside the measurement to remove it. - 10
Minimap
Shows a longer ECG file. Move the marker, or click elsewhere in the minimap, to see another part of the recording. - 11
Add to report (max. 20)
Adds the ECG strip you are viewing to the PDF report. You can add up to 20 strips. The button then changes to “Added”. To remove a strip, do so in Create PDF report. - 12
Print
Prints or saves the ECG segment you are viewing. Tick Include patient information if name and ID should be included.


Try it: scroll through the ECG with the minimap
Drag the light window in the minimap, or click anywhere in the minimap to jump there. The arrow keys also work.
Try it: display options
Turn R markers and rhythm highlighting on and off, change paper speed and gain, and switch between channel A and B.
Try it: the measuring tool
Click in the ECG and drag to measure a time interval. Drag the middle of the measurement to move it, or drag one of the edges to resize it. Click outside the measurement to remove it.
6. Beat morphology groups
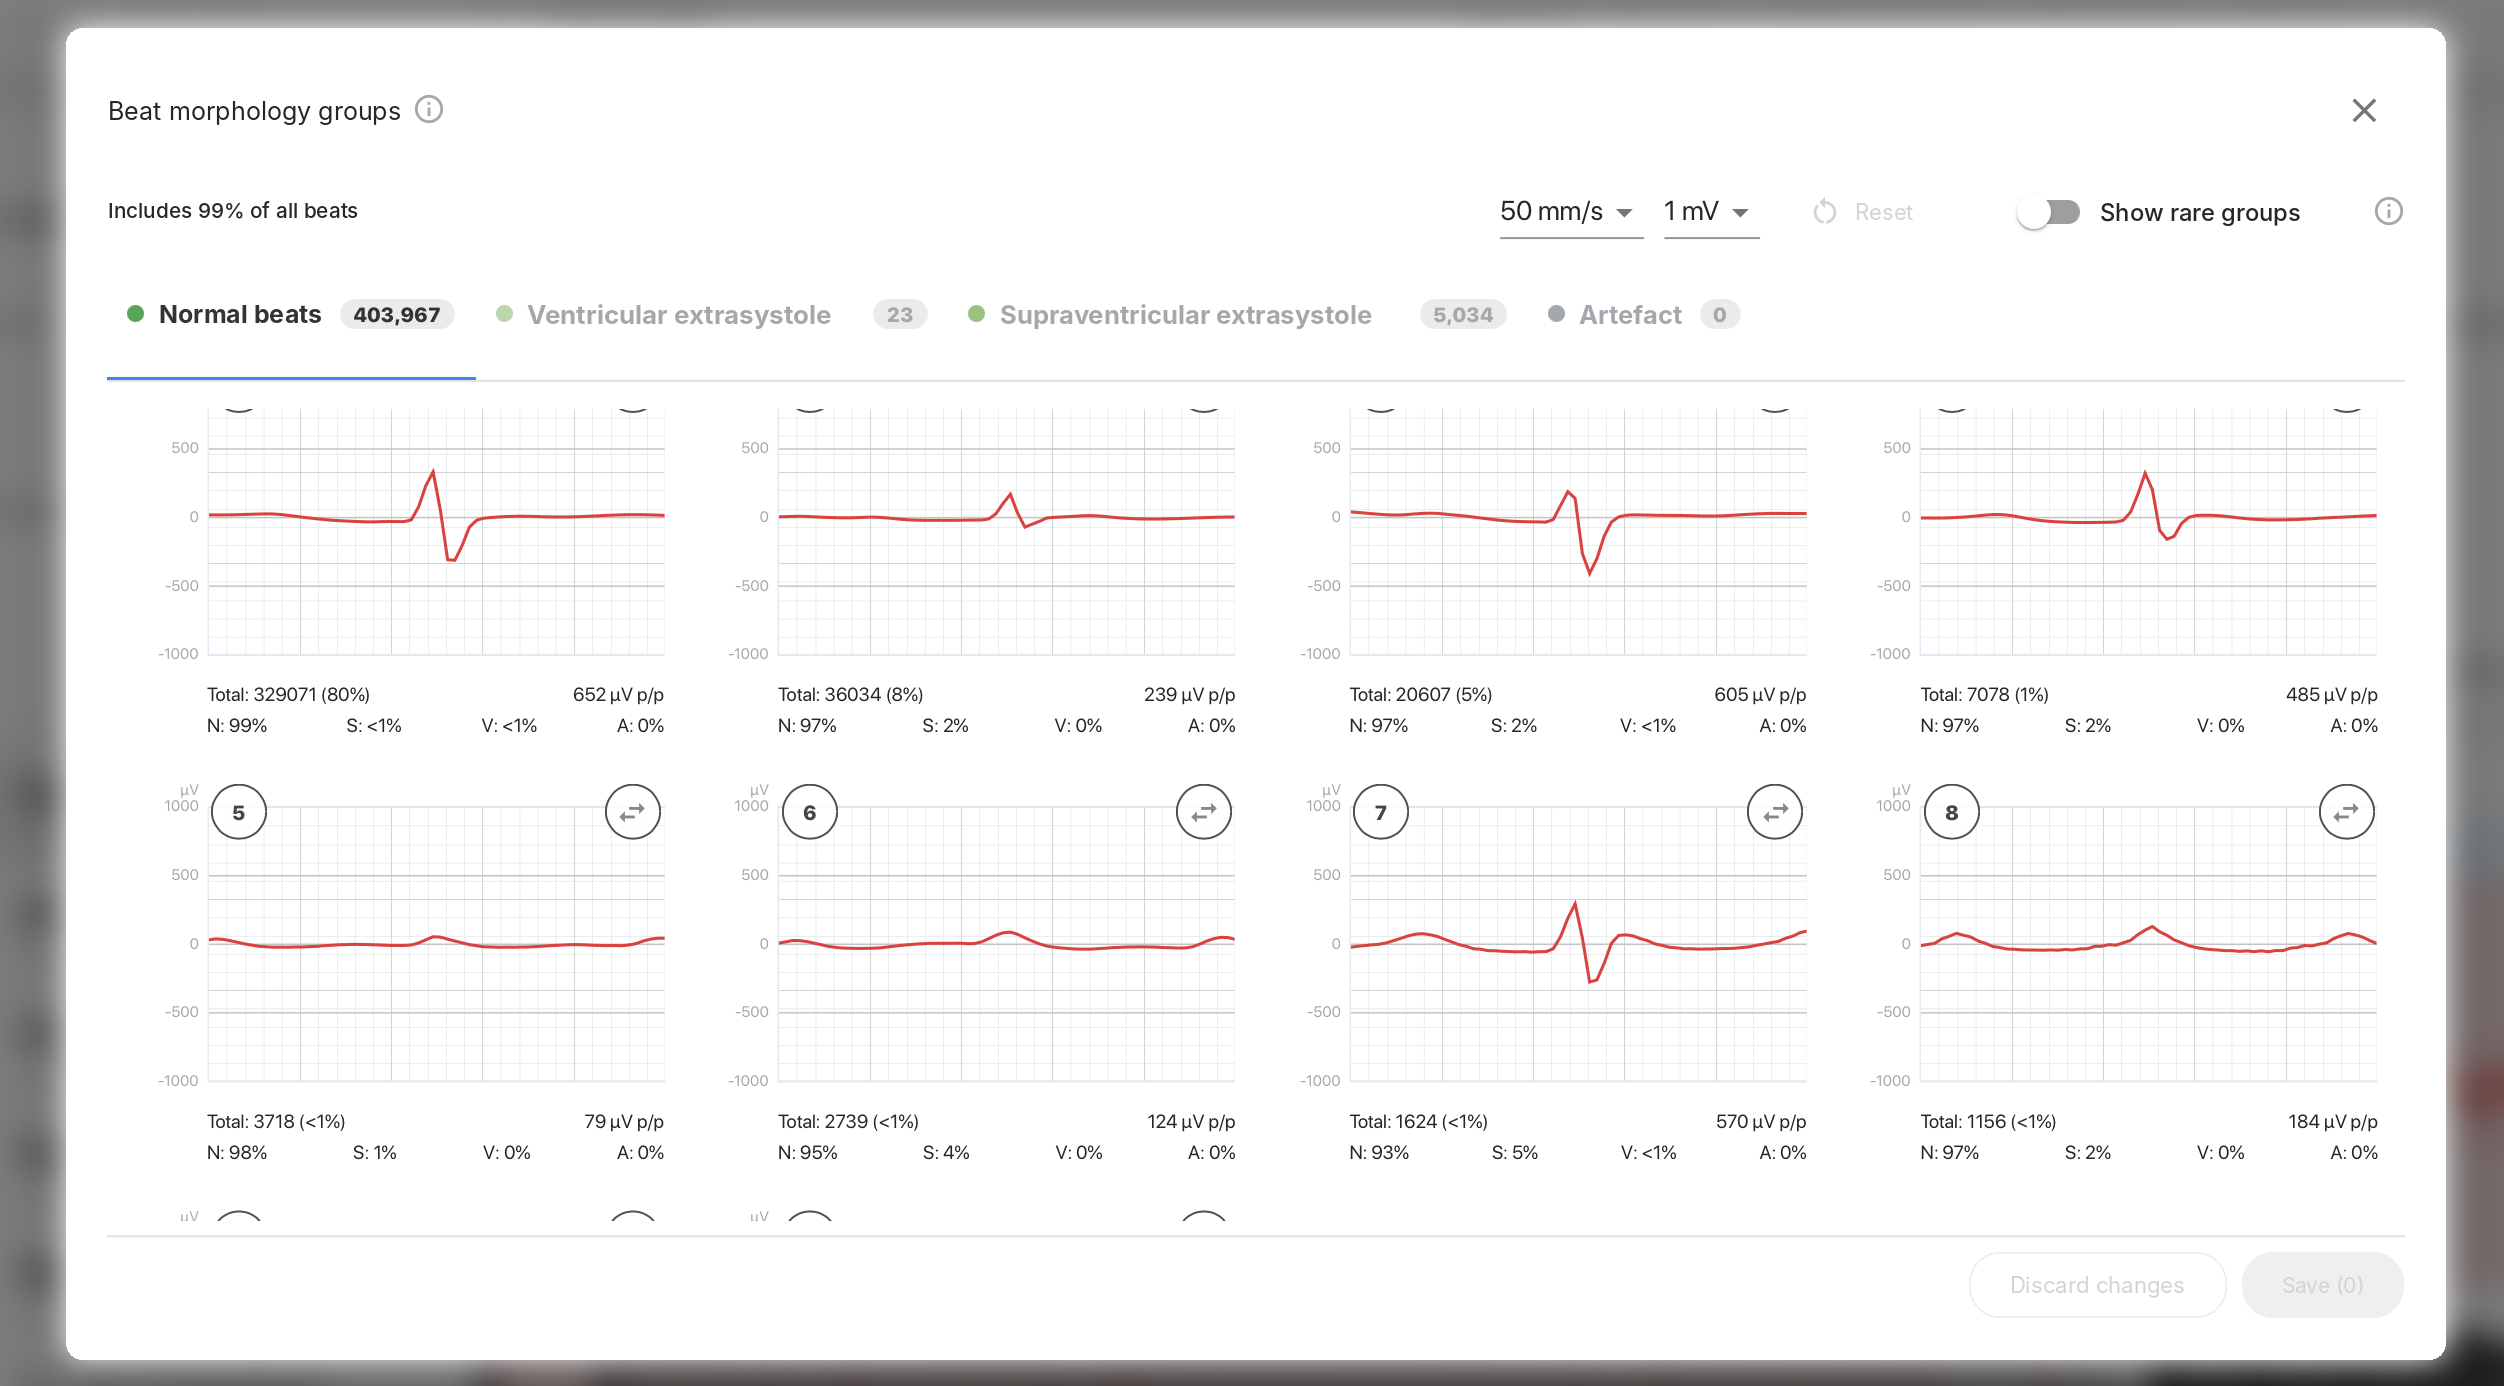
Beat morphology groups collect all beats in the recording in groups with the same QRS morphology. Each group is shown as an average beat. This lets you quickly see whether the automatic classification is correct, and you can correct whole groups at once. The changes you save affect the number of beats in the PDF report. The automatic interpretation in Summary and in the ECG tab is not changed.
You open beat morphology groups with the icon with dots in the ECG tab, or with the pencil next to “Count” in Create PDF report.
- 1
Info (i)
A short explanation of the function. - 2
Includes 99% of all beats
How large a share of the beats is included in the groups shown. - 3
Speed and amplitude
Choose 10, 25 or 50 mm/s and 0.5, 1 or 2 mV for the average beats. - 4
Reset
Removes all manual changes and returns to the automatic classification. - 5
Show rare groups
Also shows groups with few beats. - 6
Tabs per beat type
Normal beats, ventricular extrasystole, supraventricular extrasystole and artefact, with the number of beats in each. - 7
Group card
Shows the average beat of the group. The card is for display only. It shows the group number, total number of beats and share, amplitude (µV p/p) and how the beats in the group are classified (N/S/V/A). - 8
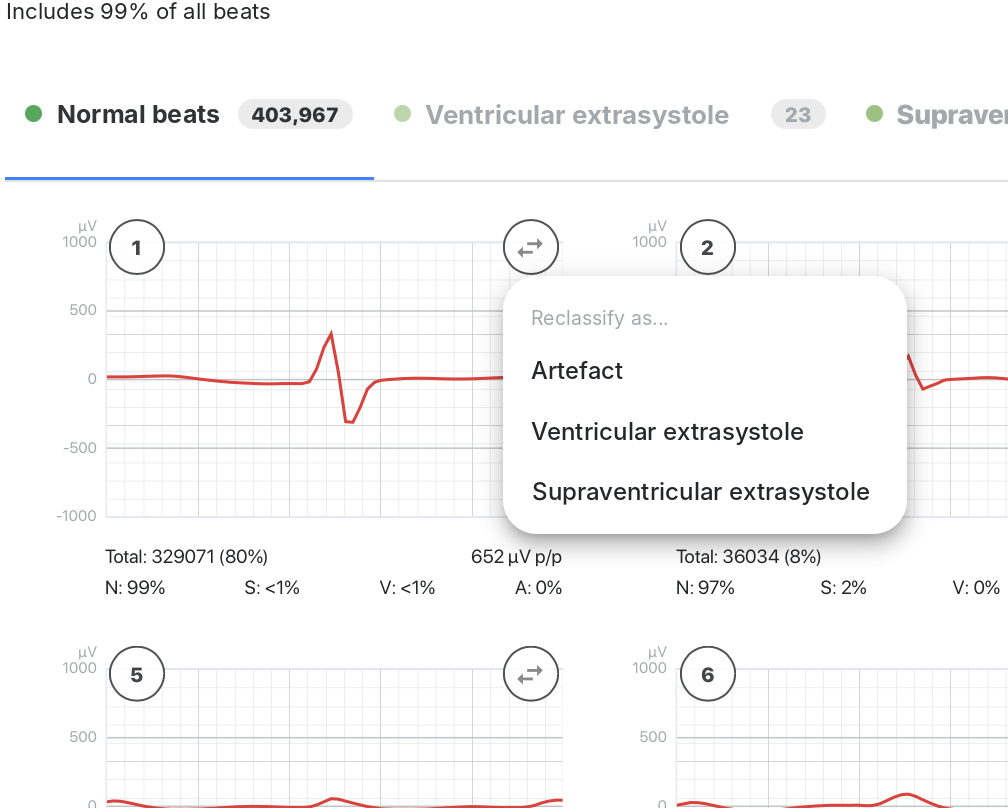
Reclassify (⇄)
The only button on the group card. Moves the whole group to another beat type. Choose the new type in the “Reclassify as…” menu. - 9
Discard changes / Save
The number on Save shows how many changes have not been saved. When you save, the number of beats in Create PDF report is updated. Discard changes undoes changes that have not been saved.


Step by step: Correct misclassified beats
- Open the ECG tab and click the icon with dots.
- Choose the tab for the beat type you want to check, for example Normal beats. Turn on Show rare groups if you also want to see small groups.
- Go through the average beats and find groups that are misclassified, for example wide QRS under Normal beats.
- Click ⇄ on the group card and choose the correct beat type.
- Click Save. The number of beats in the PDF report is updated. To start over, click Reset.
7. Heart rate
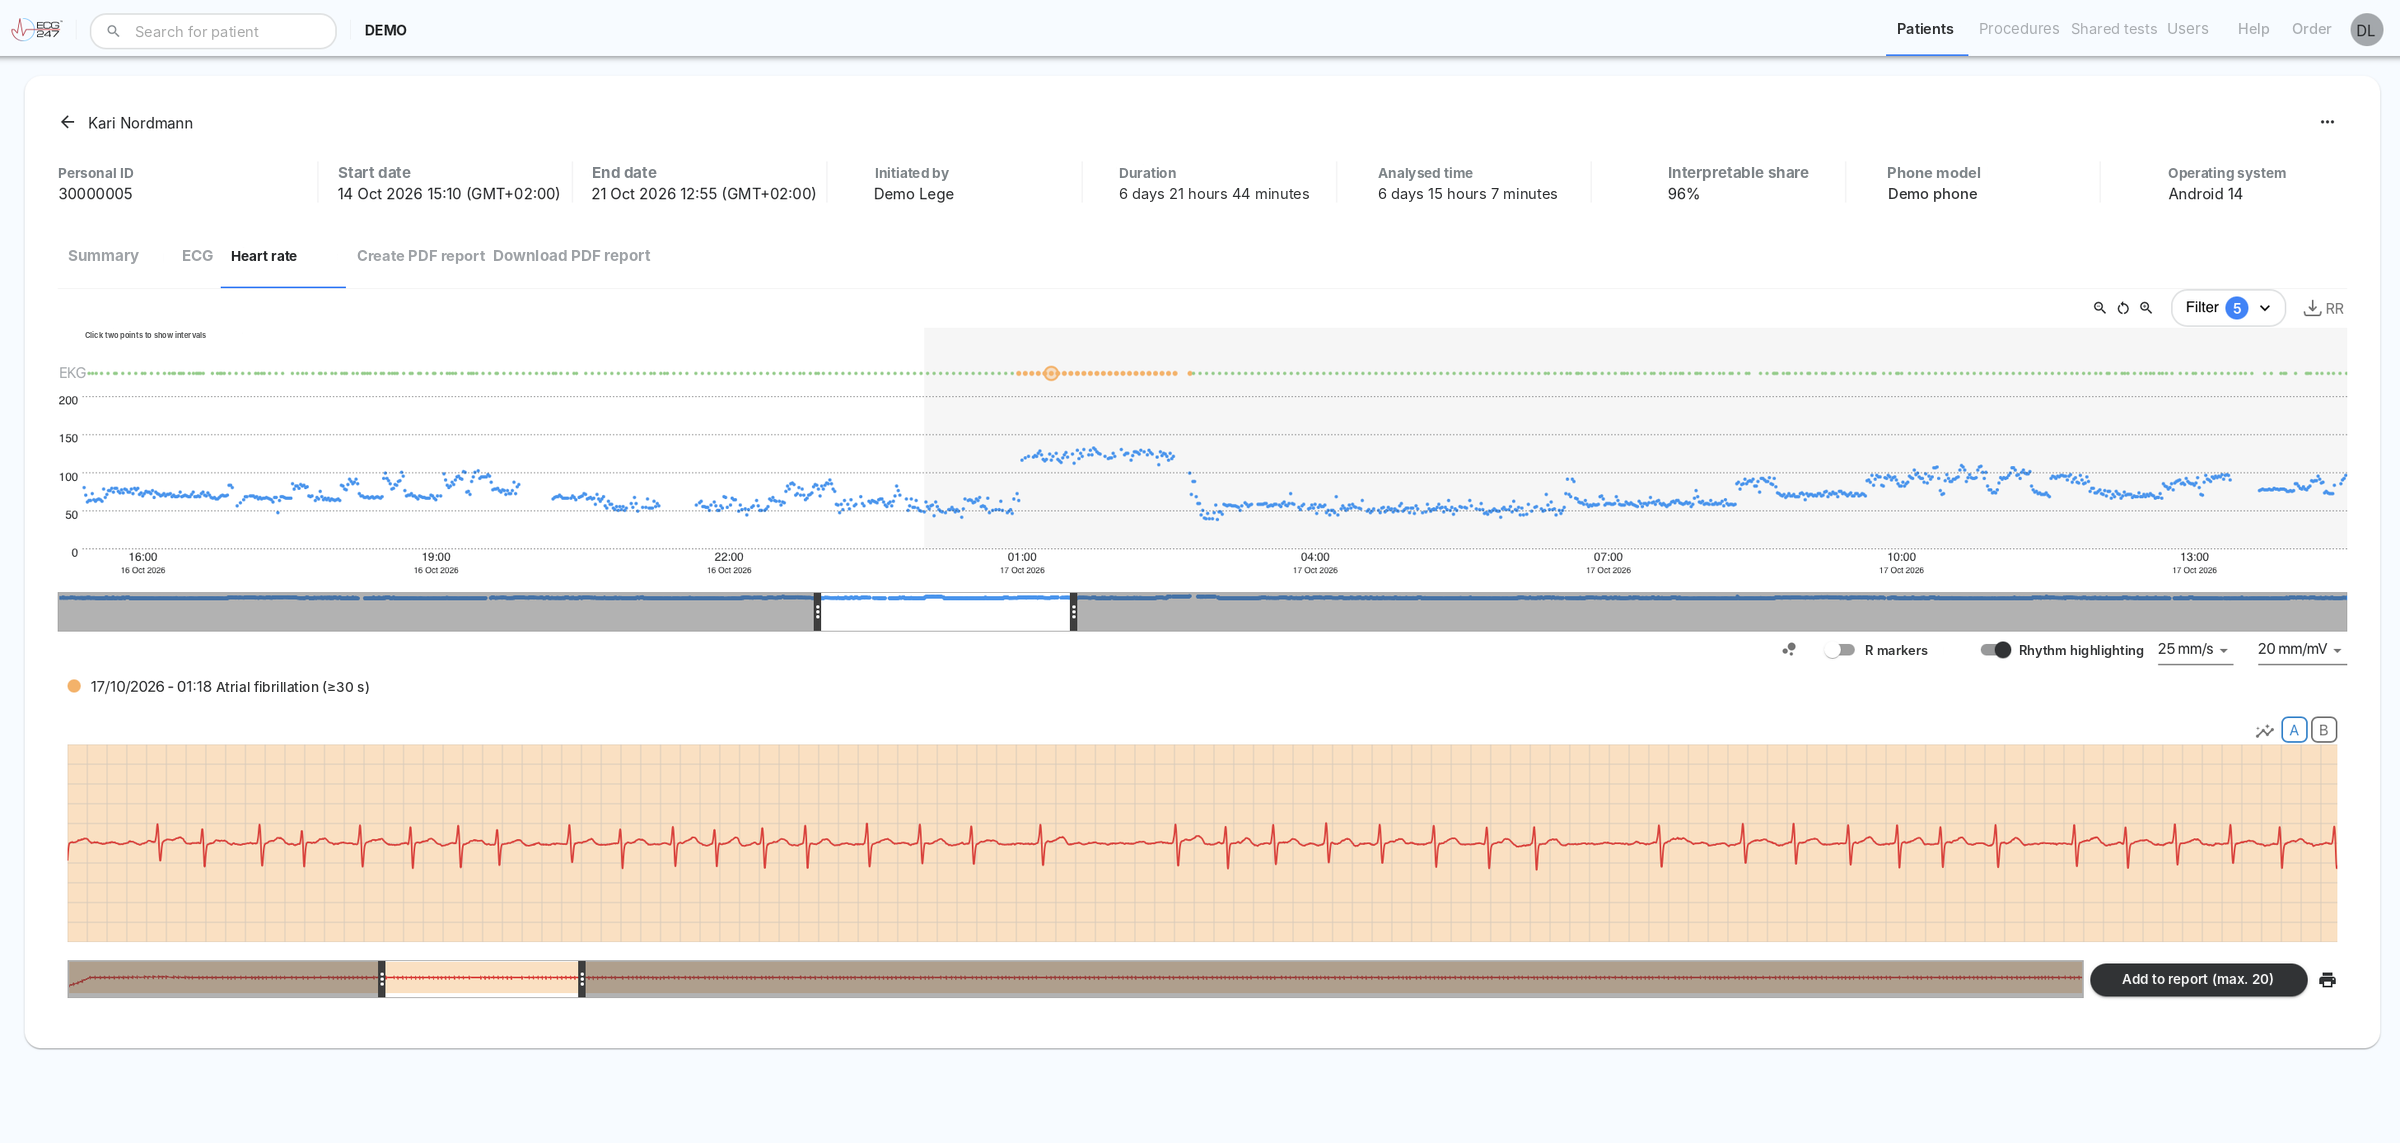
The Heart rate tab shows the heart rate throughout the recording as a trend graph. Above the graph is a row of dots showing where there are ECG recordings, colour-coded by rhythm. Click a dot to see the ECG below the graph. This shows you the relationship between rate and rhythm, for example when an episode of atrial fibrillation starts and ends.
- 1
ECG row
Each dot is an ECG recording, with the same colour code as elsewhere in the portal. Hover over a dot to see the category, and click to show the ECG at the bottom. The selected dot is marked with a ring. - 2
Heart rate graph
Heart rate (beats/min) over time. Hover over the graph to see the time and rate. - 3
Shaded background
Every other day is shaded grey, so you can easily see where one day ends and the next begins. - 4
Interval measurement
Click two points in the graph. You get the period and duration, average heart rate (SD), median (IQR), lowest and highest rate with time, and average 1-minute HRV. The copy icon copies the values, for example to a clinical note. - 5
Zoom out / reset / zoom in
Changes how long a period the graph shows. - 6
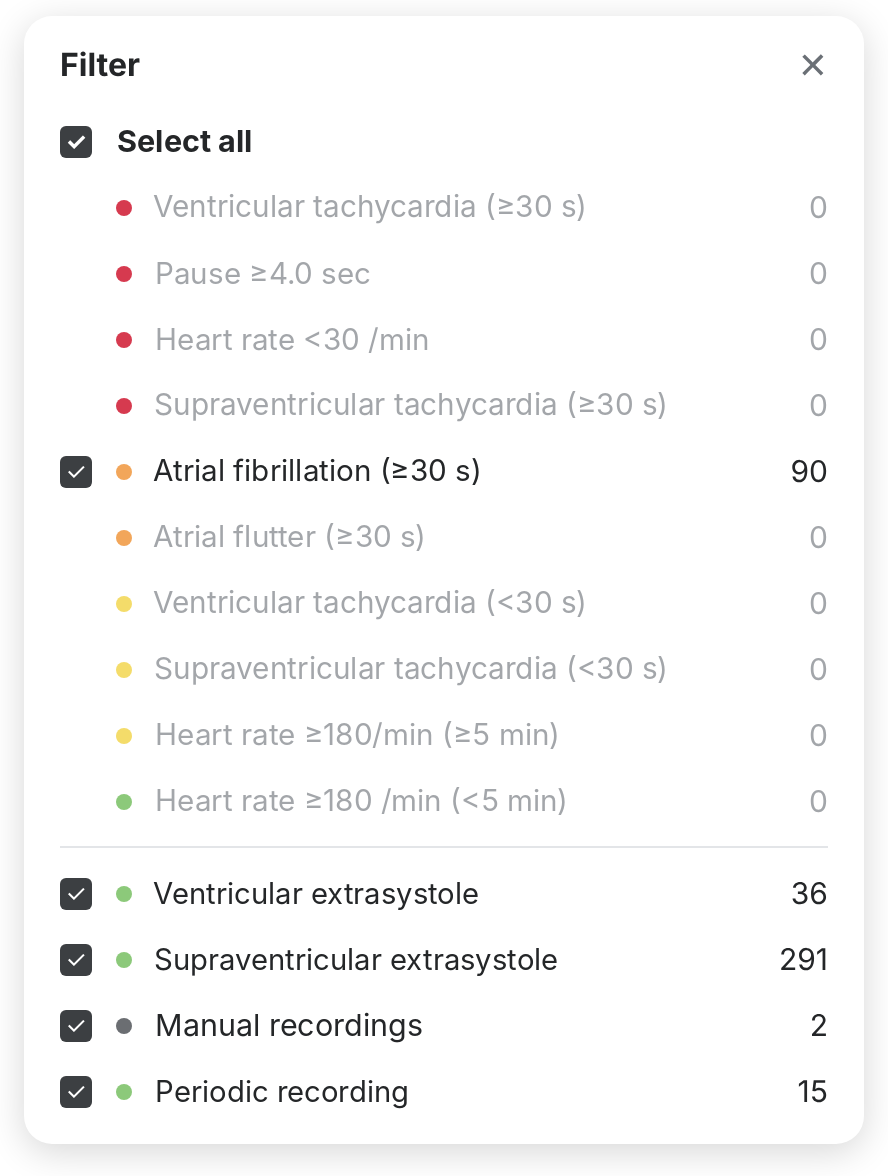
Filter
Choose which ECG categories are shown as dots in the ECG row. The number of recordings is shown next to each category. The number on the button shows how many categories are selected. - 7
Download RR
Downloads a CSV file with the timestamp and duration in ms of all RR intervals, for further analysis. - 8
Overview strip
Shows the whole recording. Drag the window to scroll, drag the edges to change the period, or click somewhere to jump there. - 9
ECG view
Has the same options as the ECG tab: beat morphology groups, R markers, rhythm highlighting, mm/s, mm/mV, A/B, minimap, Add to report and Print.
Try it: the heart rate graph
Scroll through the recording by dragging the window in the overview strip. Drag the edges or use zoom to change the time span. Click two points in the graph to get statistics for the interval. Click a dot in the ECG row to select an ECG.
8. Create PDF report
In Create PDF report you put the report together. Here you see the summary as it will appear in the report, write your assessment and go through the ECG strips you have selected. Click Create report when you are finished. The report can then be downloaded under Download PDF report, and the test gets the status Reported. You can also create a report while the test is in progress, and you can change the content and create a new PDF as many times as you like.
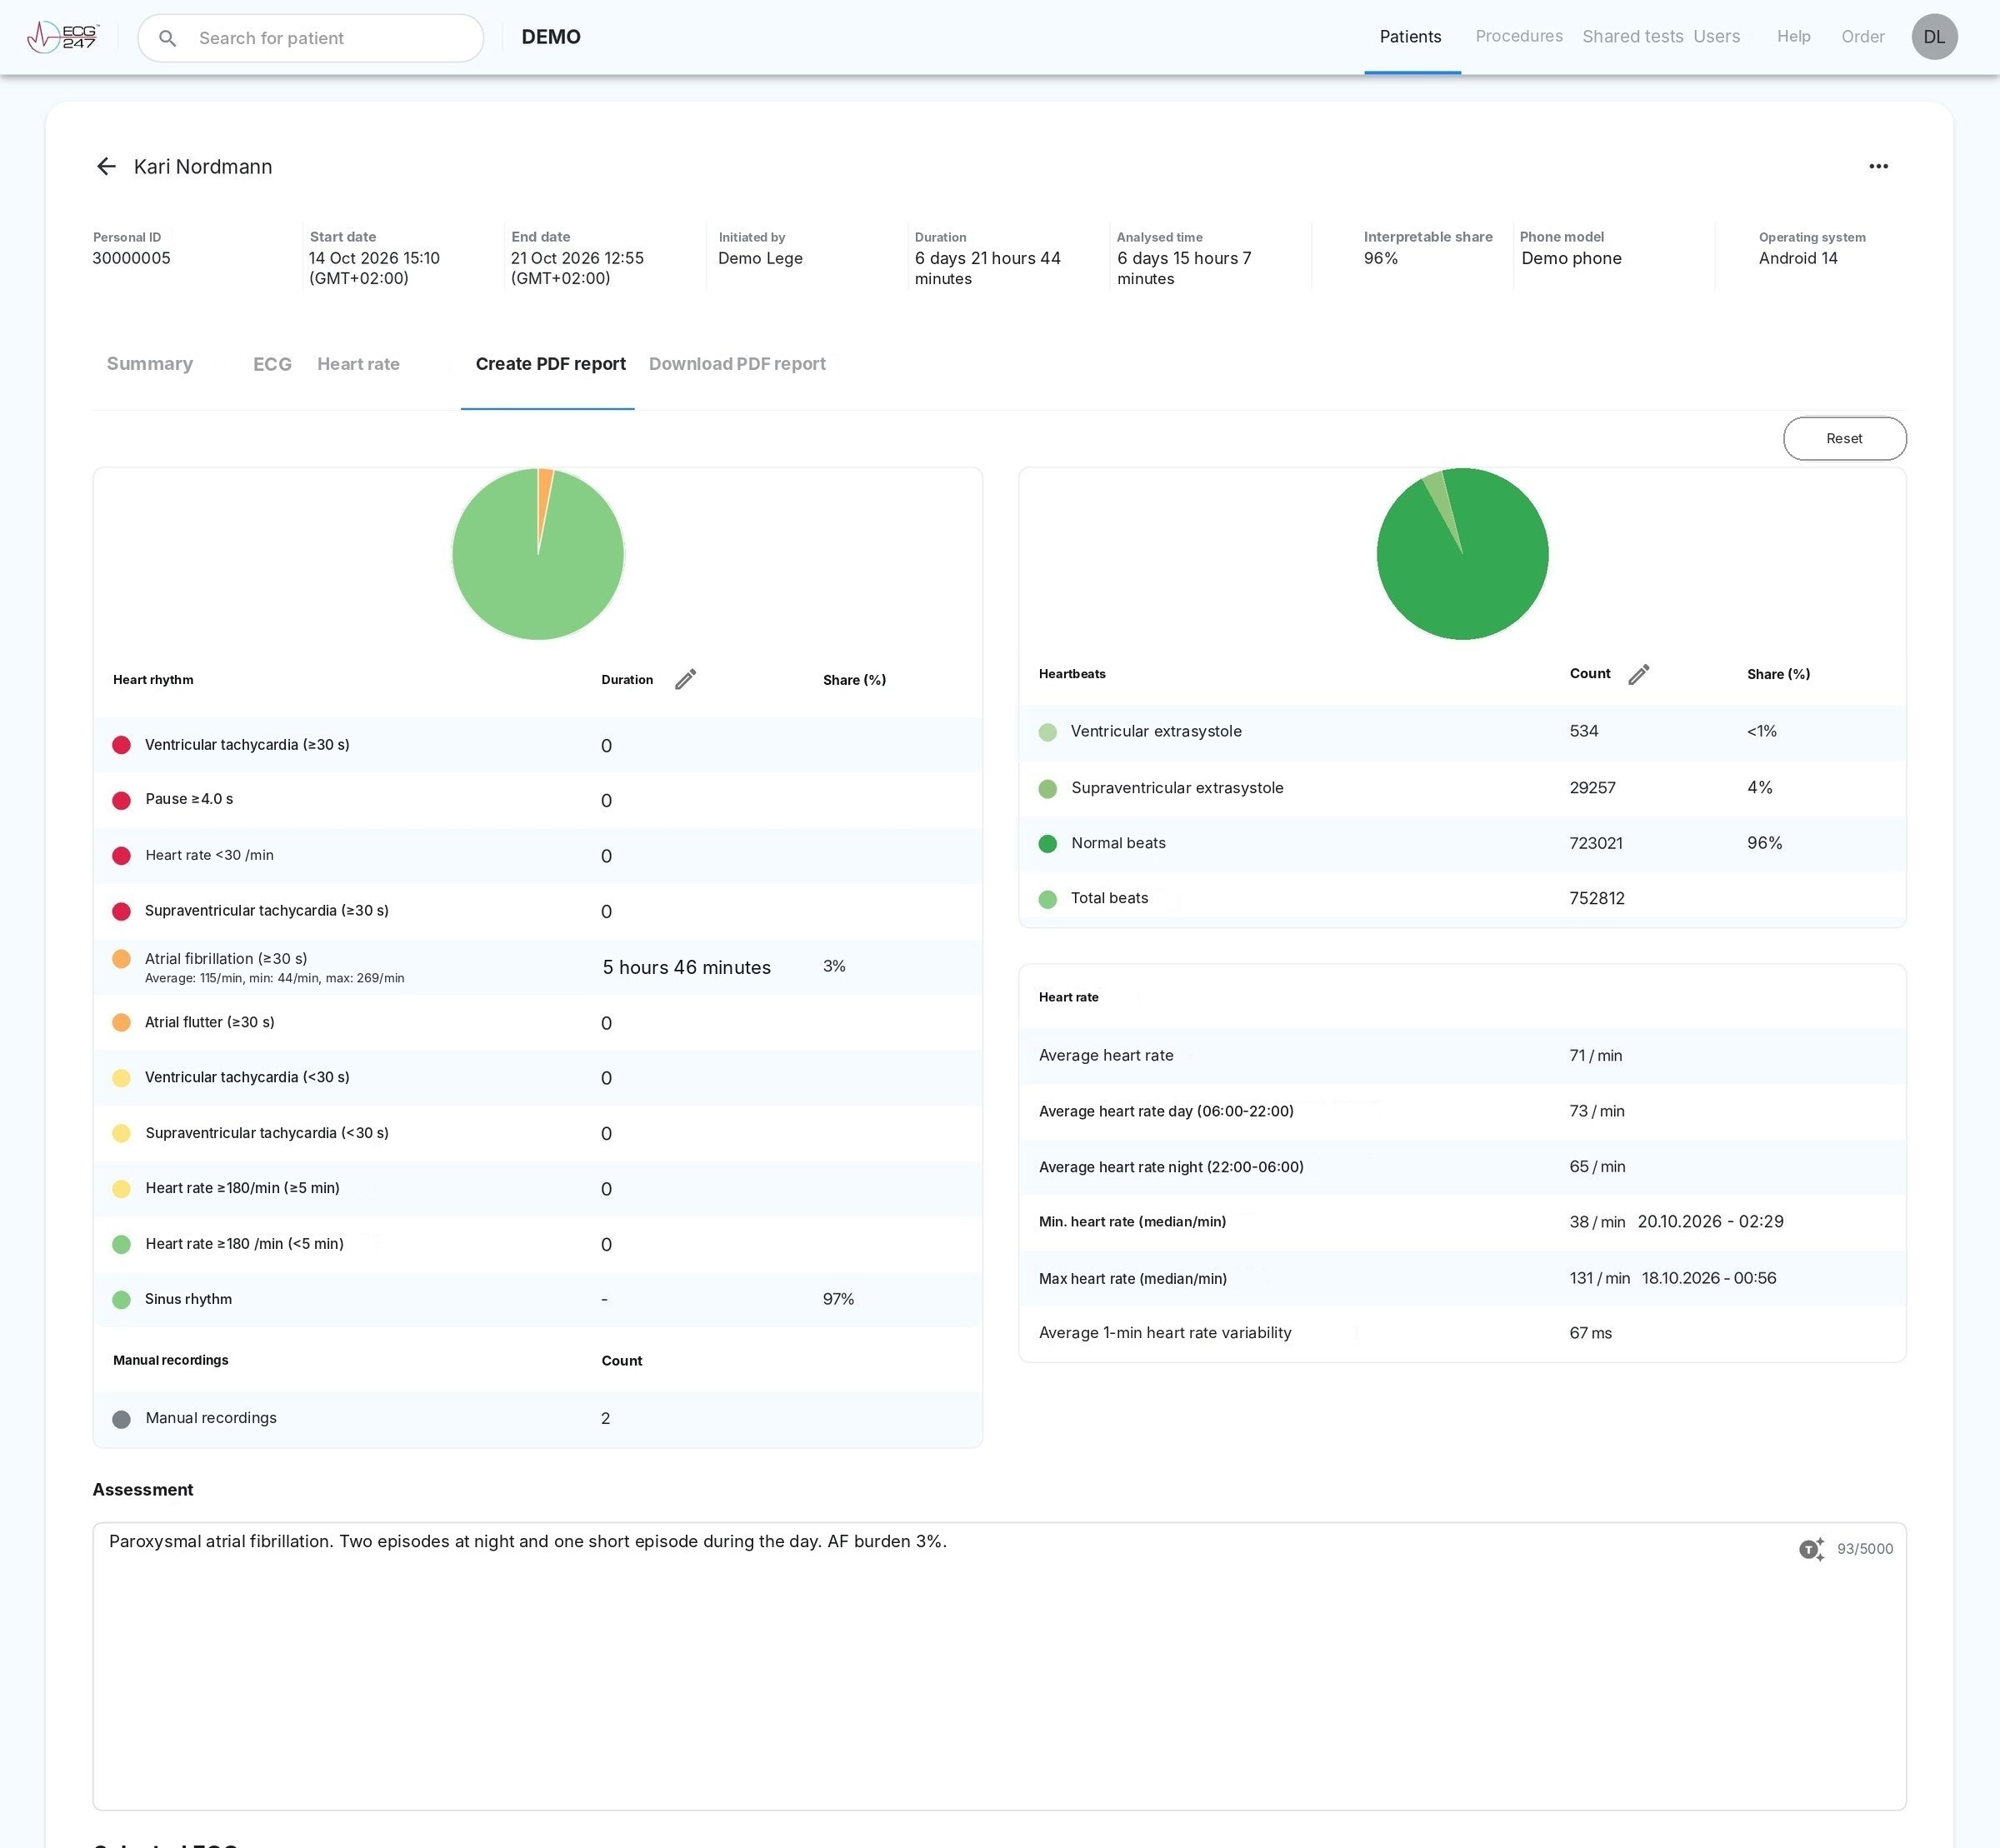
- 1
Reset
Restores the original results from the automatic analysis and removes manual changes. - 2
Heart rhythm
The same figures as in Summary. - 3
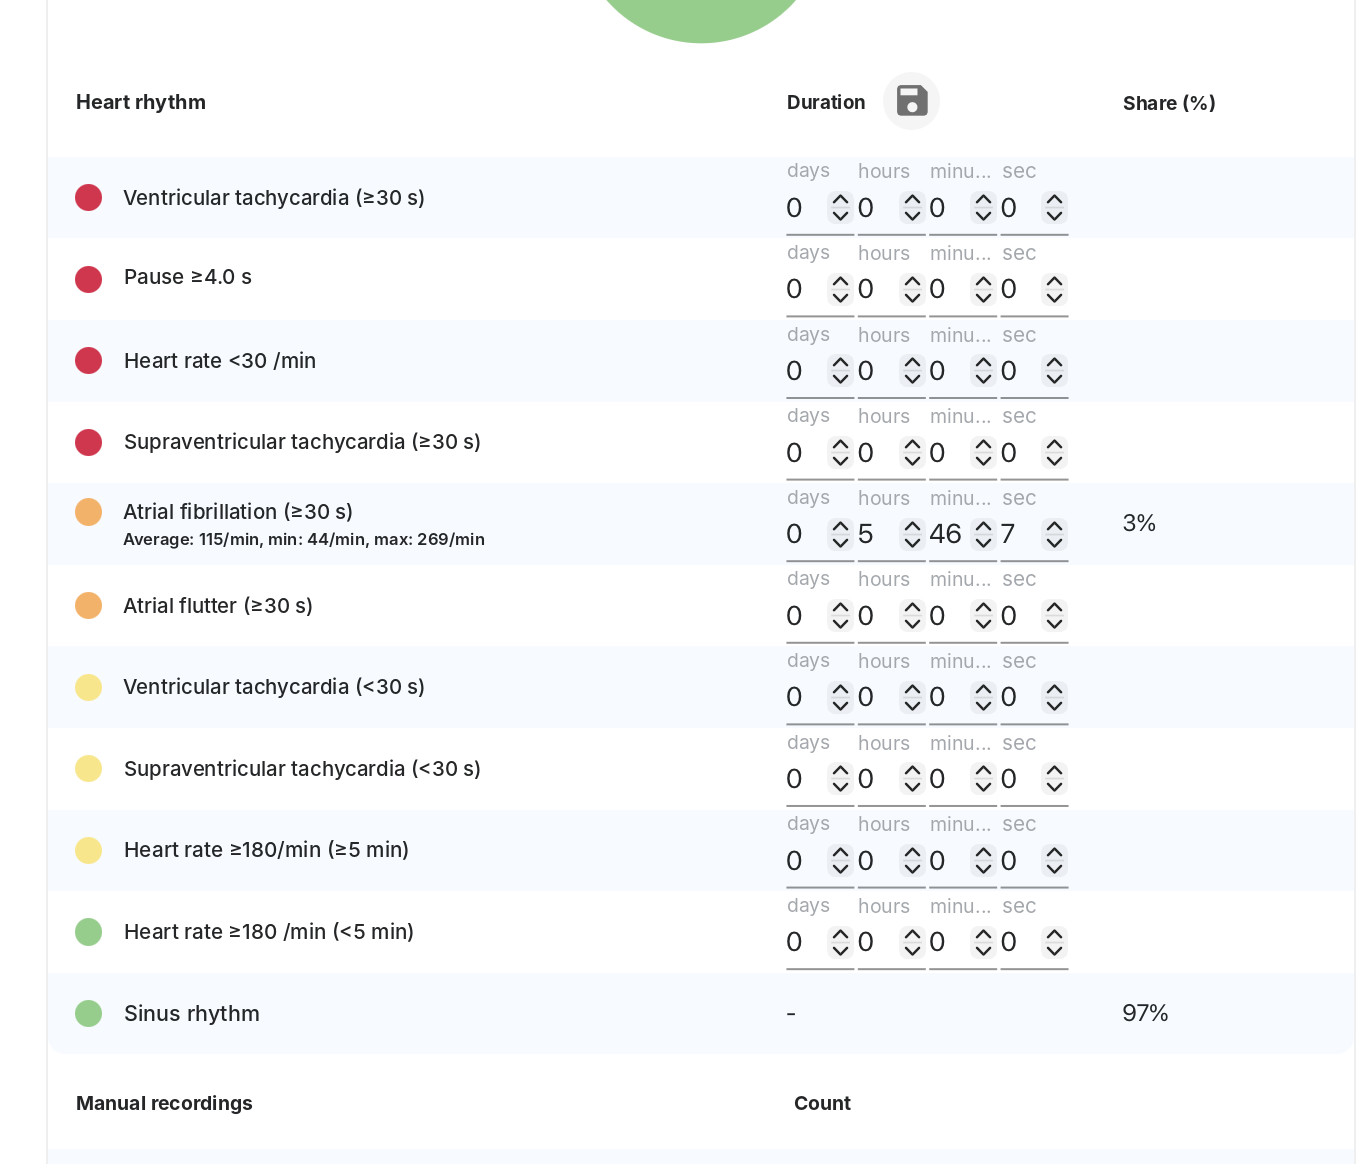
Pencil next to Duration
Here you can correct the duration of each rhythm category in days, hours, minutes and seconds. Save with the disk icon. The changes only apply to the report. - 4
Pencil next to Count
Opens beat morphology groups. Changes you save there update the number of beats here. - 5
Heart rate
Average, day and night, lowest and highest, and HRV, as in Summary. - 6
Assessment
Free text for your assessment, max. 5000 characters. - 7
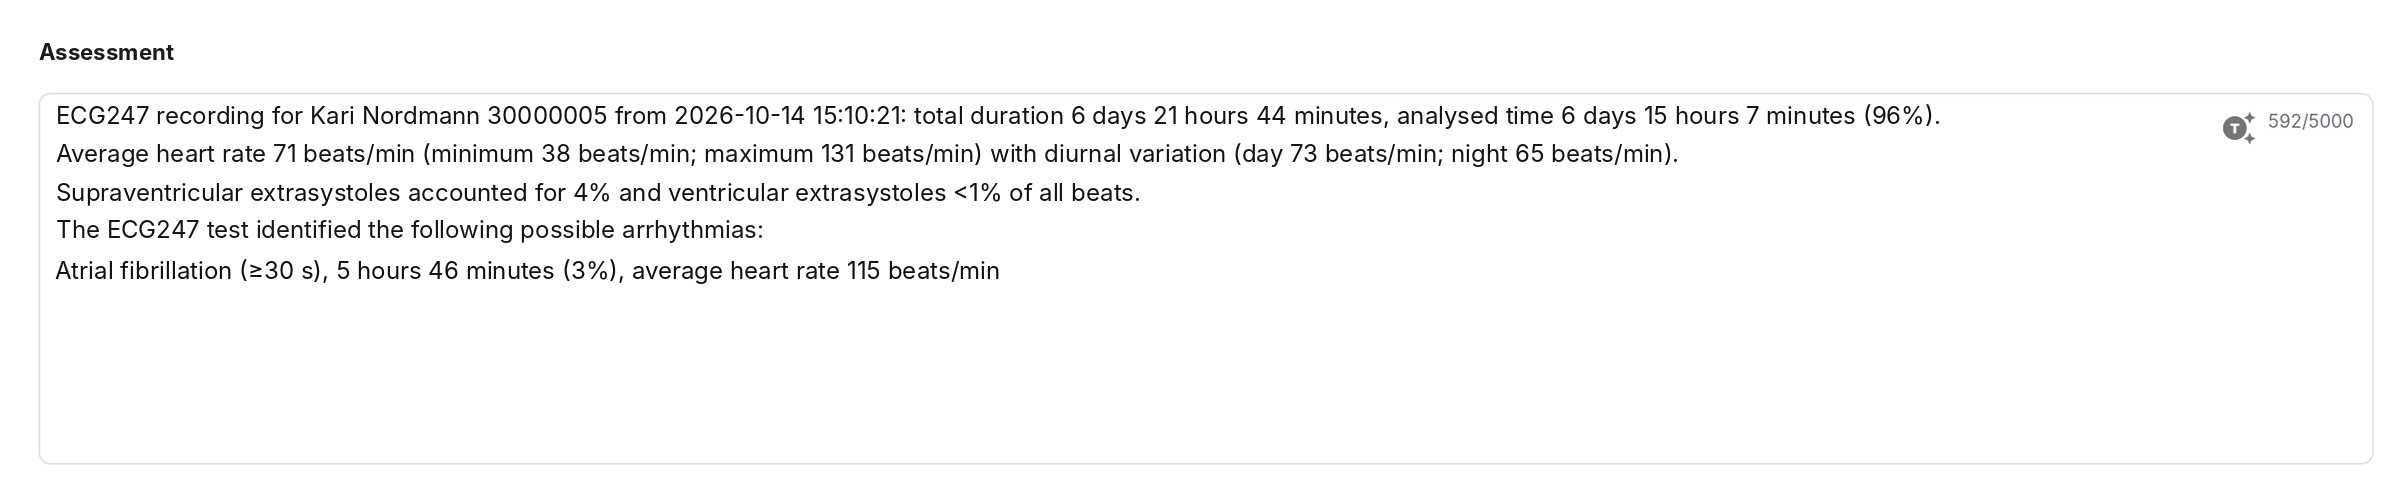
Autotext (T icon)
Creates a suggested text based on the results. You can edit the text freely.

- 8
Selected ECGs
The strips you have added from the ECG or Heart rate tab, max. 20. Each strip has its own options for R markers, rhythm highlighting, mm/s, mm/mV and A/B, and its own minimap. The section and view you choose here are included in the report. - 9
Copy
Creates a copy of the strip, so you can show another section or other display options from the same recording. - 10
Bin
Removes the strip from the report. - 11
Add a comment
Add a comment to the strip. The comment is included in the report.

- 12
Heart rate section
The heart rate graph with zoom and overview strip. The period you choose is included in the report. - 13
Copy and eye
Copy: creates a copy, for example to show another period. Eye: hides the section, so it is not included in the PDF report. - 14
Create report
Creates the PDF report. You can change the content and create a new PDF later.
Step by step: Create and download a report
- Select ECG strips with Add to report in the ECG or Heart rate tab (max. 20).
- Open Create PDF report and check the figures. If needed, correct durations (the pencil next to Duration) and beat classification (the pencil next to Count).
- Write the assessment, or click the T icon for a suggestion you can edit.
- Go through the strips. Adjust the section and view, write comments, and remove or copy strips as needed.
- Click Create report.
- Download the report under Download PDF report.
9. Download PDF report
Here you find the PDF reports created for the test. Each time you click Create report, a new row is added.

- 1
Test report
The file name contains the personal ID and the time the report was created. - 2
Created by and Date
Who created the report, and when. - 3
Status
Completed means that the PDF is ready and can be downloaded. - 4
Download
Downloads the PDF report. - 5
Bin
Deletes the report. The test then returns to the status In progress or Completed.
10. Procedures
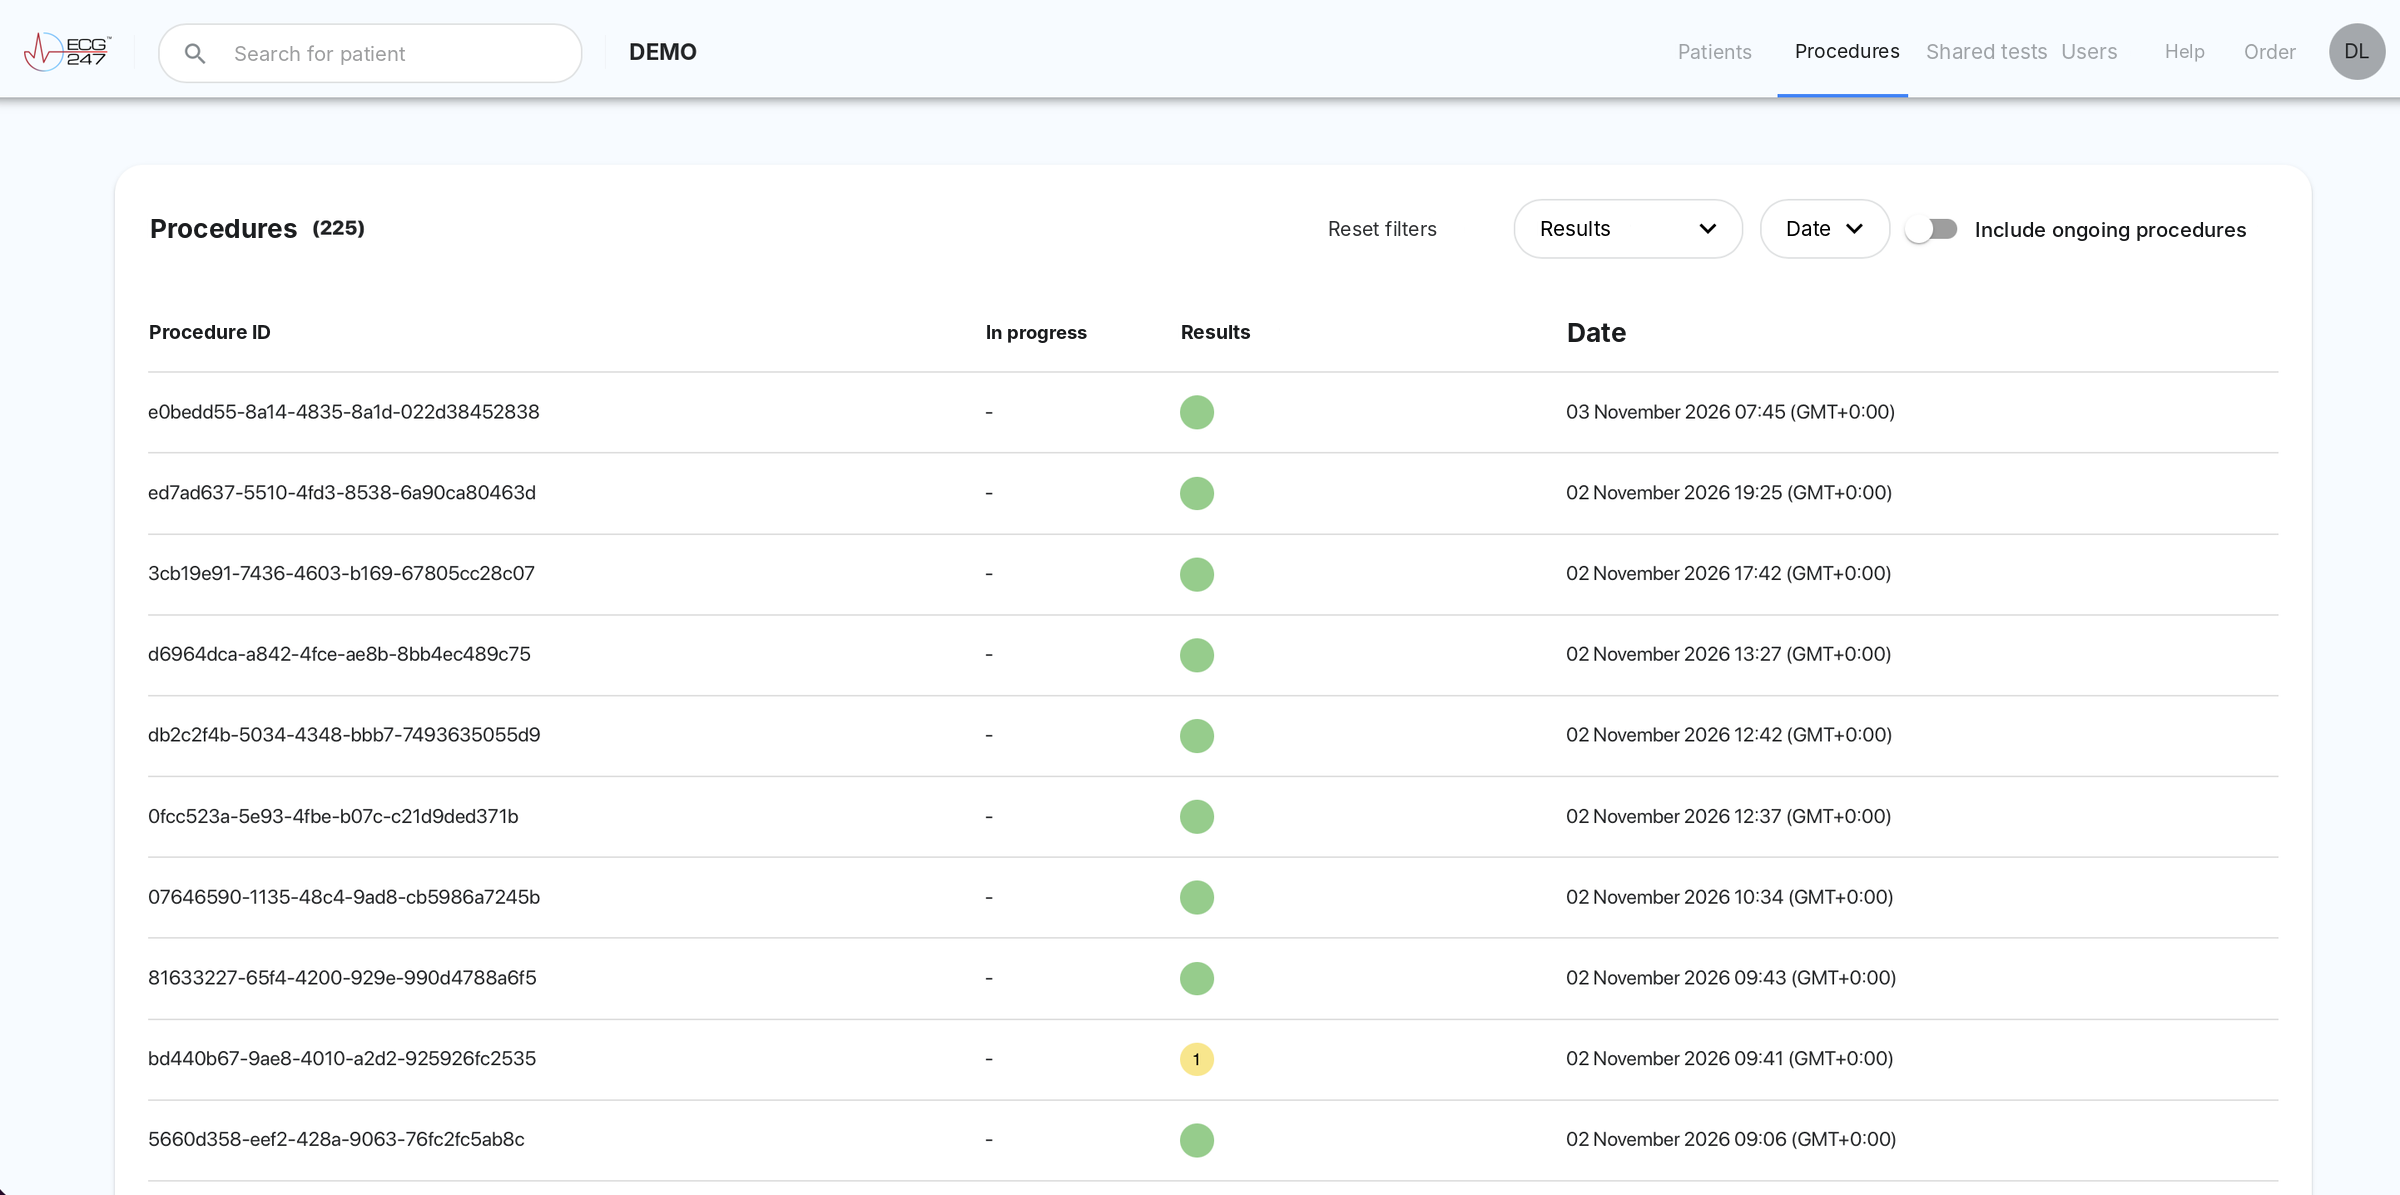
Procedures shows all tests in the organization, one row per test. The patient list has one row per patient, while here you see each test separately. This is useful when patients have several recordings, or when you want to find all tests with a particular finding in a given period.
- 1
Procedures (number)
The number of tests shown with the filters you have selected. - 2
Procedure ID
The unique ID of the test. The patient name is not shown in the list. Click a row to open the test. - 3
In progress
“In progress” means that the recording is still running. “-” means that the test has ended. - 4
Results (filter)
Filter by arrhythmia. Tick one or more categories and click Apply. - 5
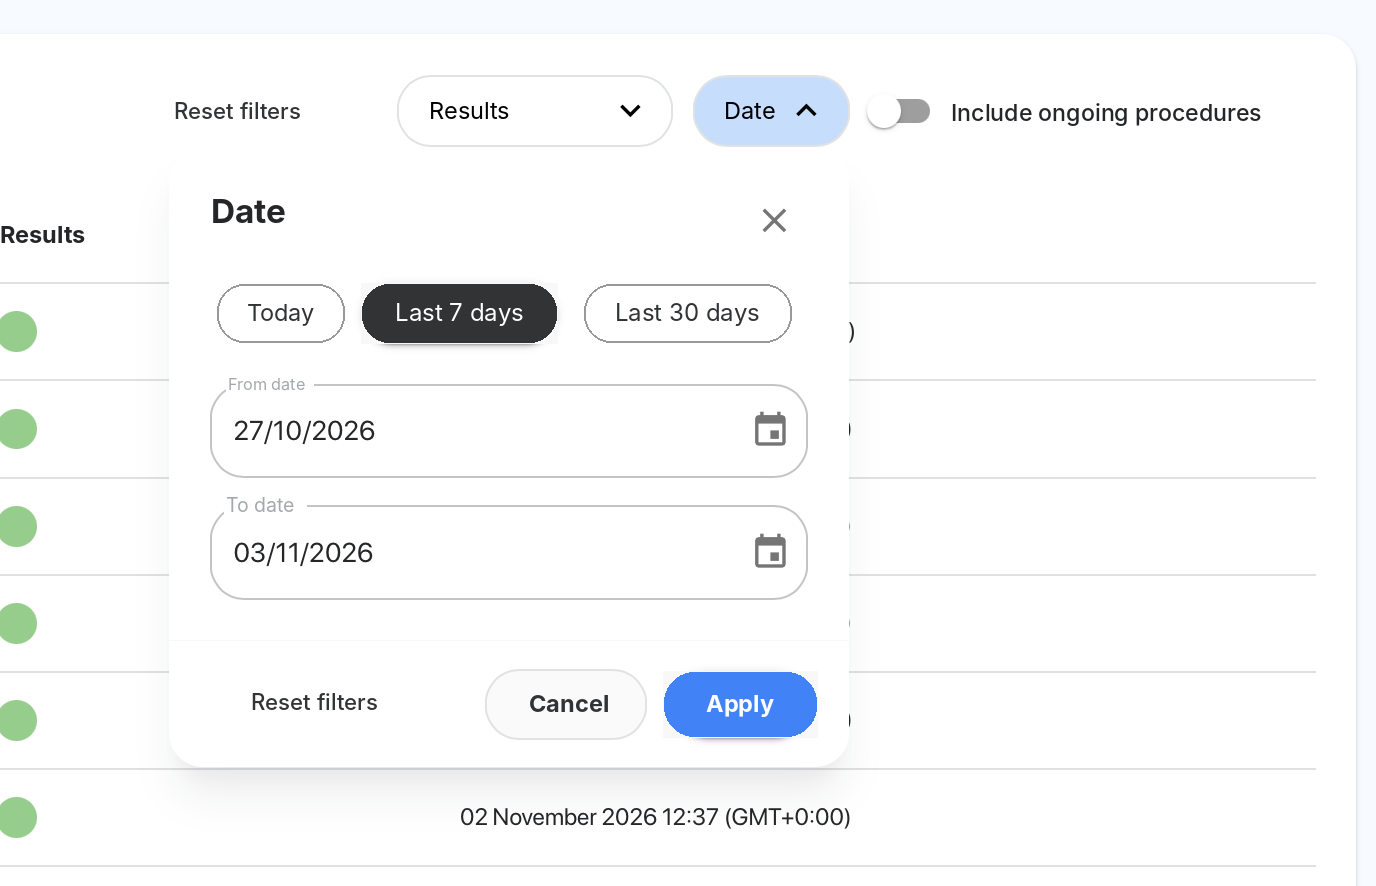
Date (filter)
Choose Today, Last 7 days or Last 30 days, or enter a from and to date. Click Apply. - 6
Reset filters
Removes all filters. - 7
Include ongoing procedures
Includes tests that have not ended. When the switch is off, only ended tests are shown. - 8
Results (column)
A colour-coded circle for the most severe finding, with the number of ECG files (99+ means more than 99). A green circle without a number means no arrhythmia findings. - 9
Date (i)
Date and time of the first event with the highest severity in the test.



11. Shared tests
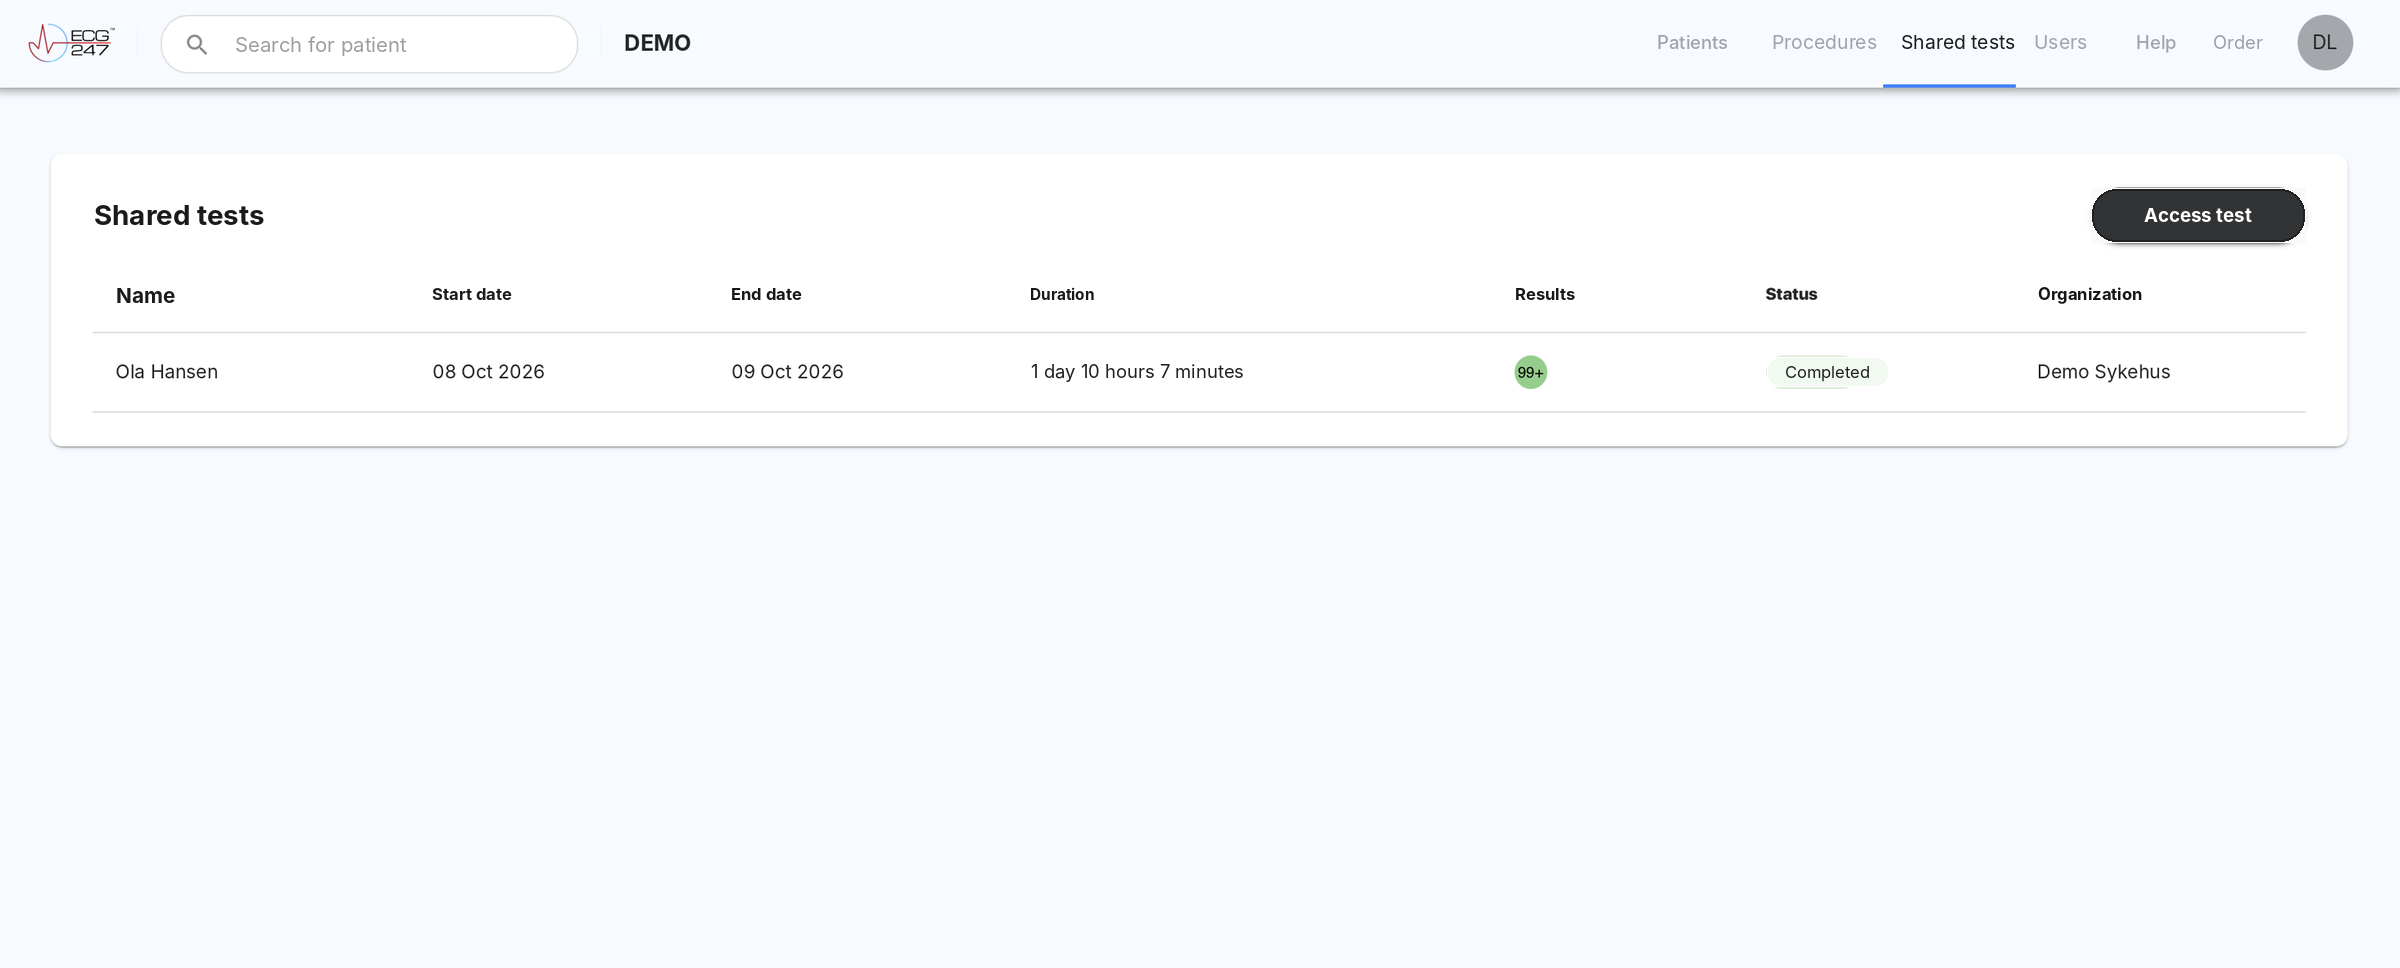
Shared tests are tests started in another organization that you have been given access to for review. Access is granted with a sharing code. The patient finds the code in the ECG247 app. Health personnel in the organization that started the test create the code in the portal (Menu → Share access, see Summary). This way, for example the GP or the hospital can review a recording the patient made elsewhere.
- 1
The list
One row per shared test, with the patient's name, start and end date, duration, results, status and the organization the test was shared from. - 2
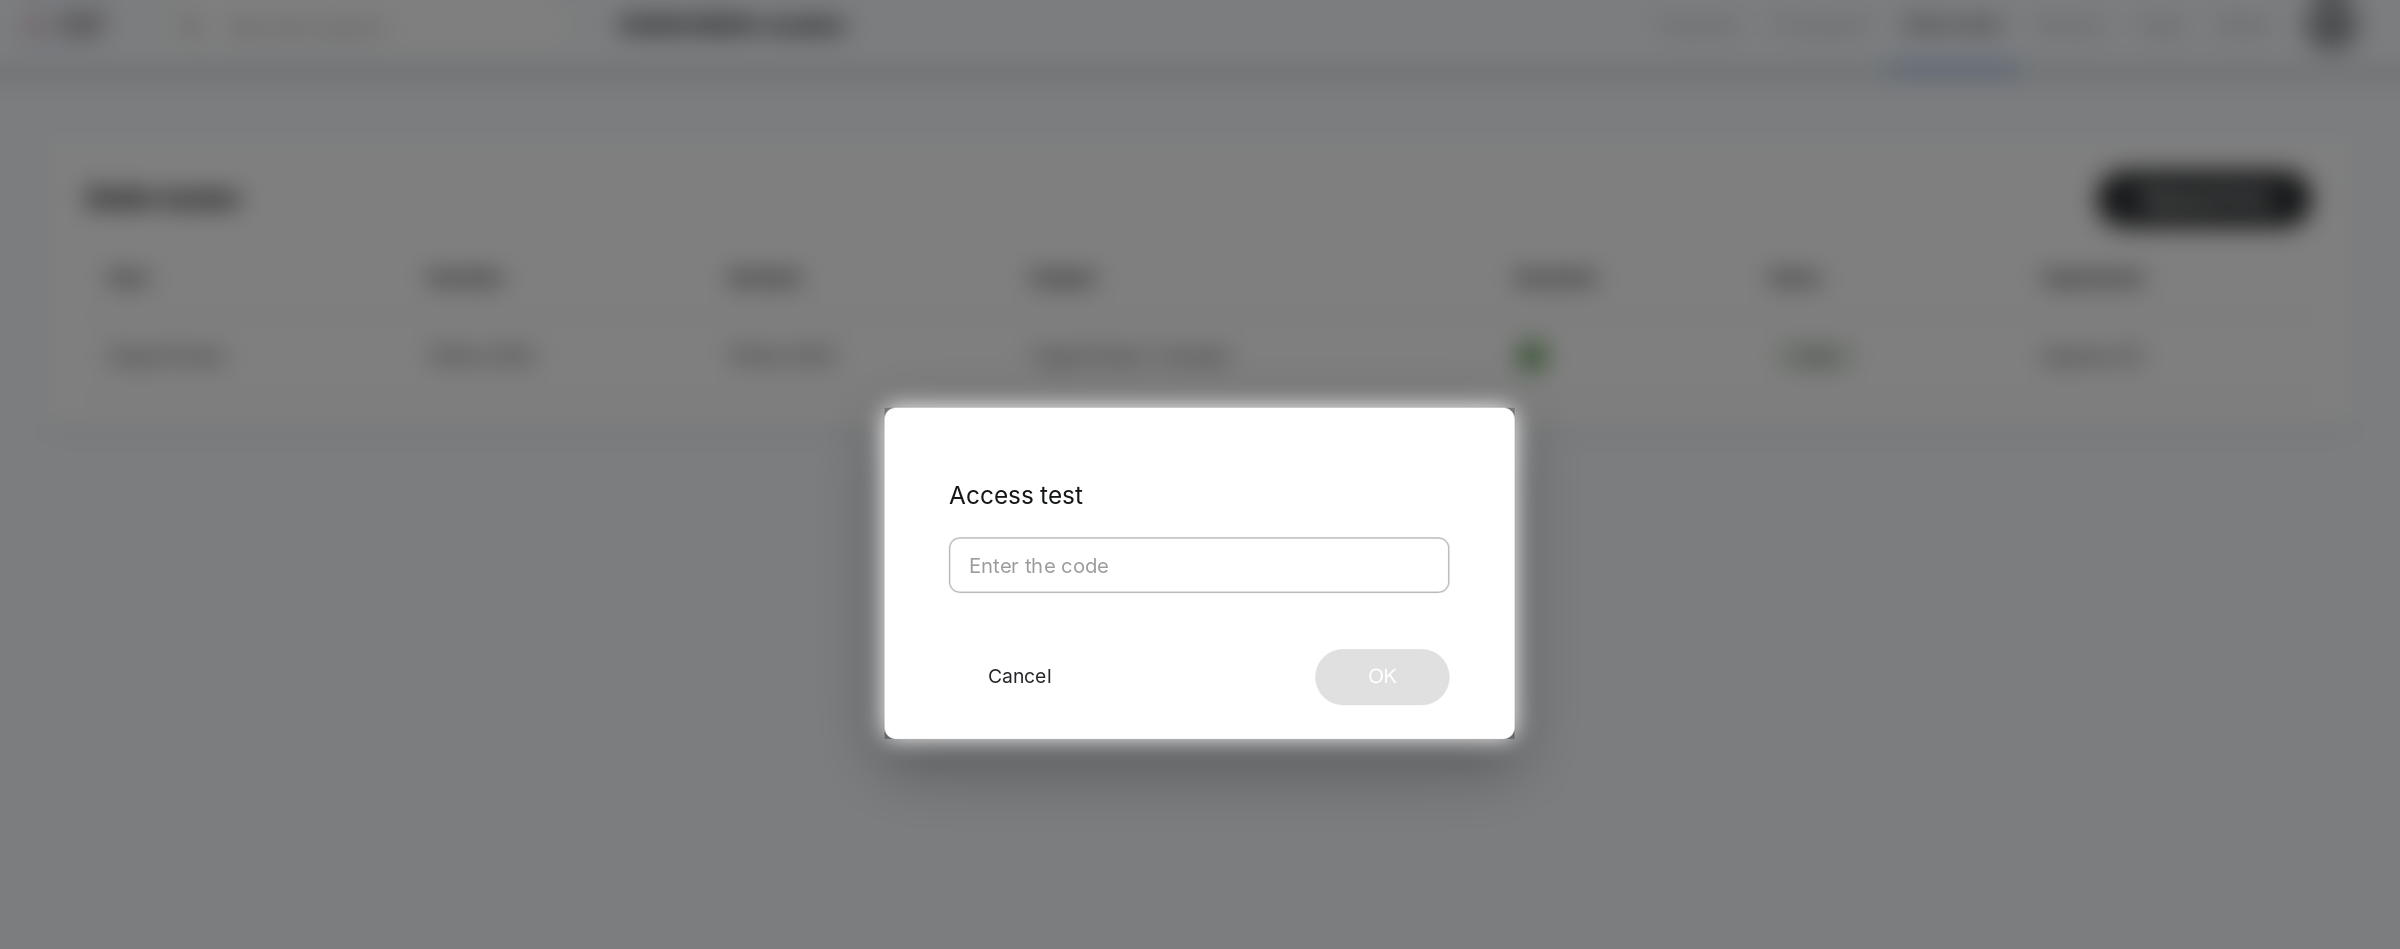
Access test
Enter the sharing code and click OK. The test is then added to the list. - 3
Click a row
Opens the test. A shared test is reviewed in the same way as your own, with the same tabs and the option of a PDF report. The organization that shared the test can withdraw access at any time.
Step by step: Open a test that has been shared with you
- Ask for a sharing code from the patient (in the ECG247 app) or from health personnel in the organization that started the test.
- Go to Shared tests and click Access test.
- Enter the code and click OK.
- Click the test in the list to open and review it.
Step by step: Share a test with another organization
- Open the test and click the menu (…) in the top right corner.
- Choose Share access to create a sharing code.
- Give the code to health personnel in the other organization.
- Under Manage access you see who the test is shared with, and you can withdraw access.
12. Users
Under Users you manage health personnel with access to the organization. Here you add new users, edit or delete users and edit the details of the organization.
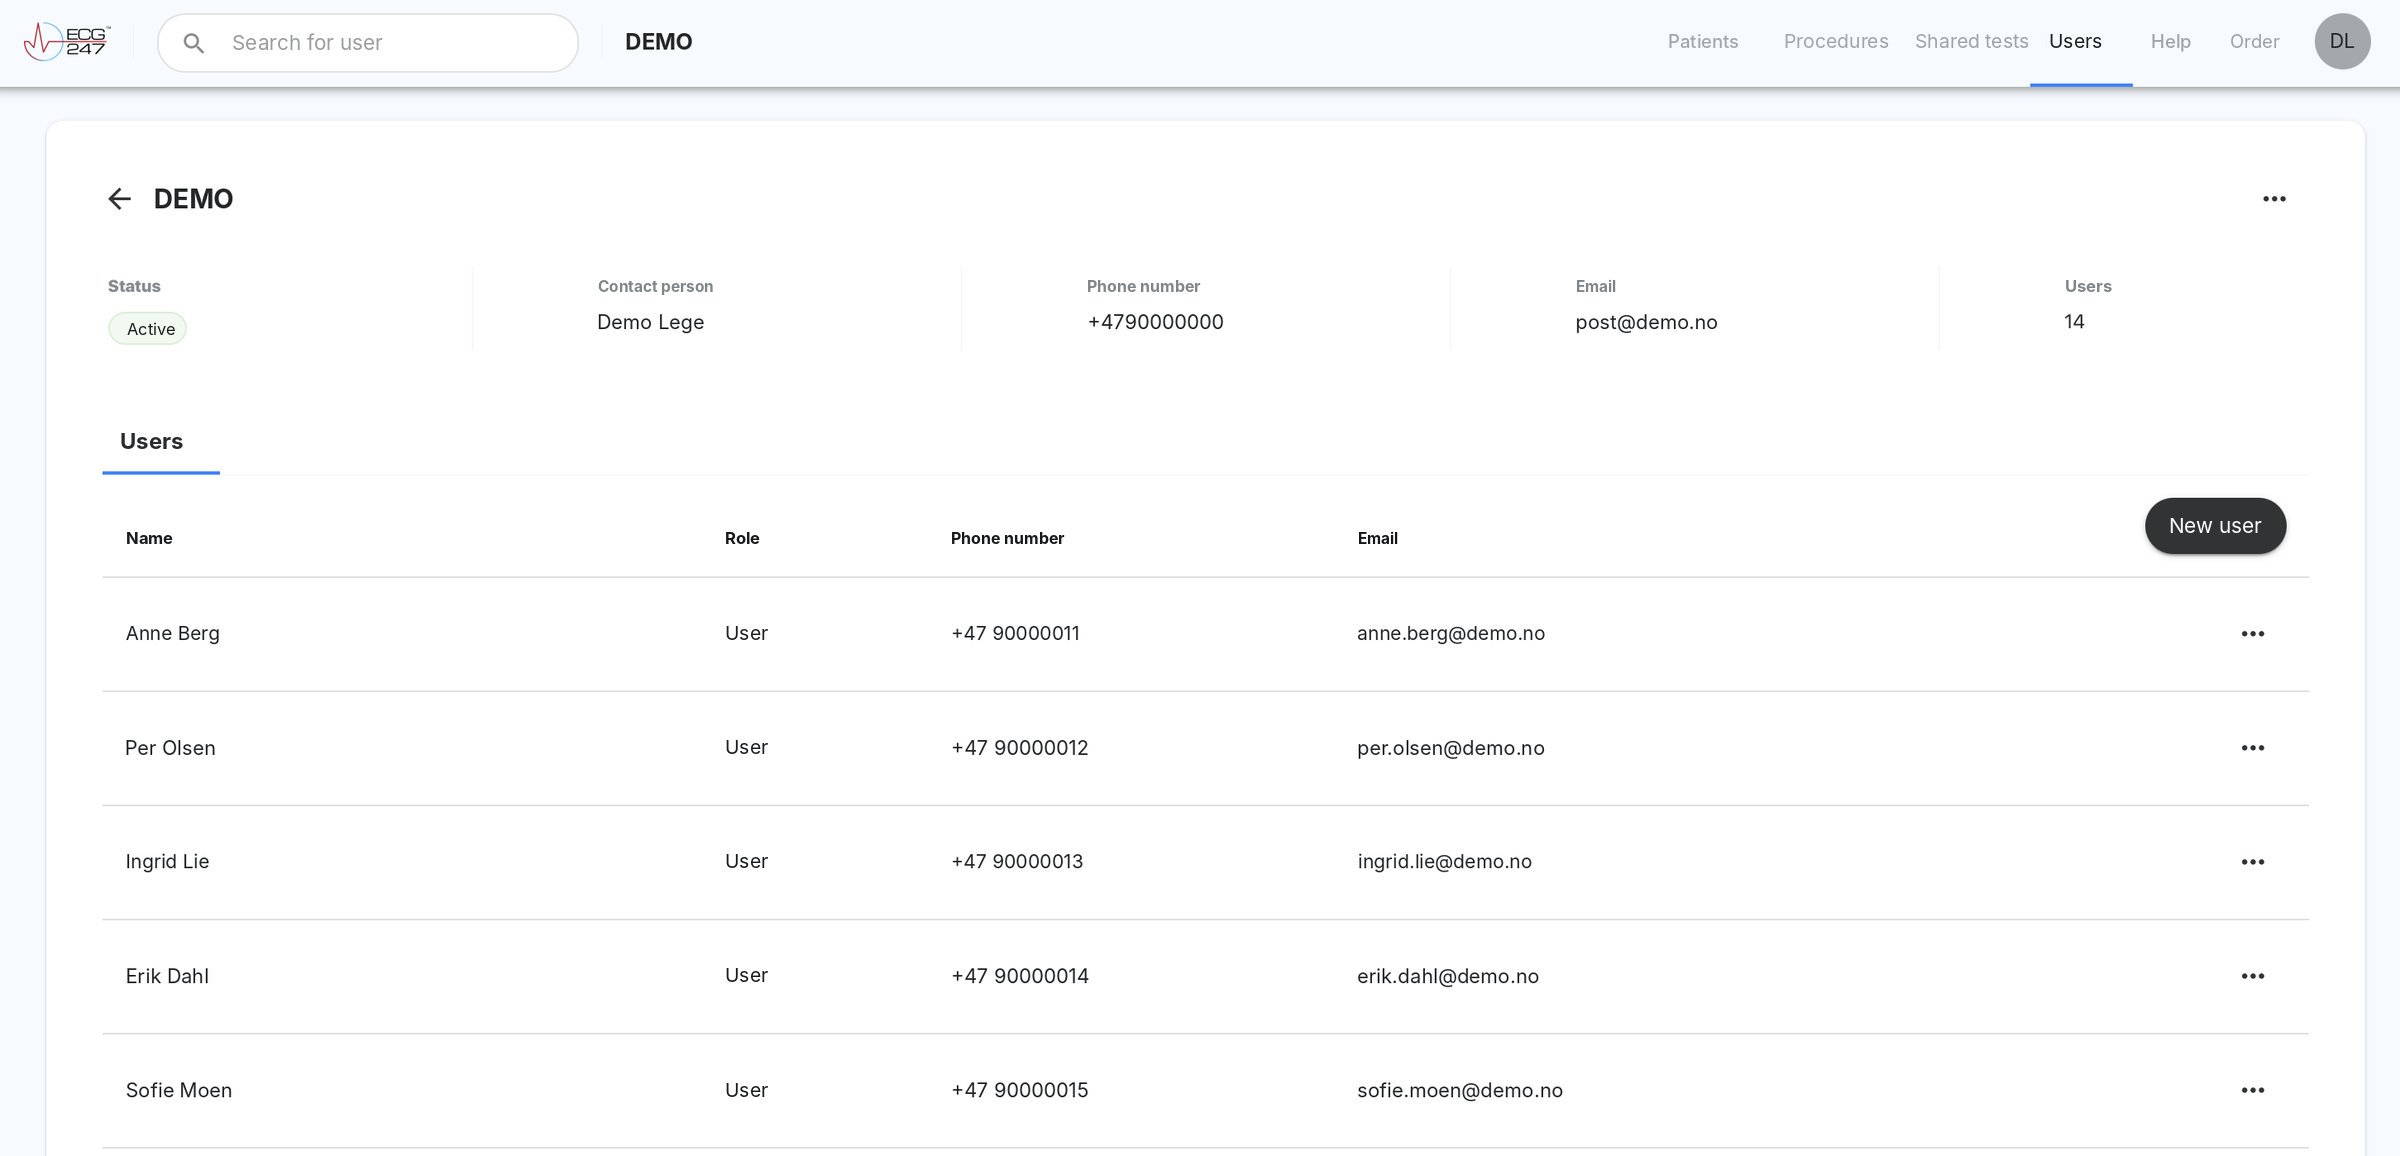
- 1
Search for user
On this page, the search field searches for users instead of patients. - 2
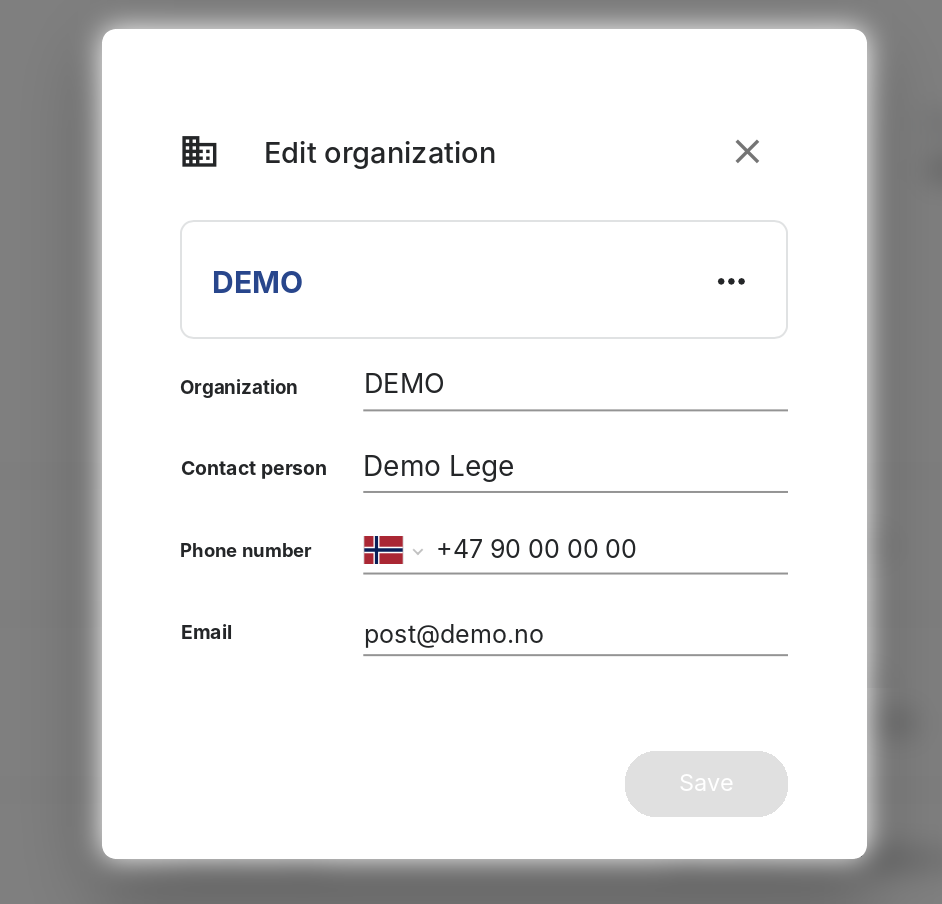
Organization and menu (…)
Status, contact person, phone, email and number of users. Choose Edit organization in the menu to change the logo, name, contact person, phone and email. The logo is shown, among other places, on the QR invitation to the patient. - 3
User list
Name, role, phone number and email for each user. - 4
New user
Choose a role and enter name, phone number (optional), email and password. User: has access to all patients and tests in the organization. User – restricted access: only has access to patients the user has created. - 5
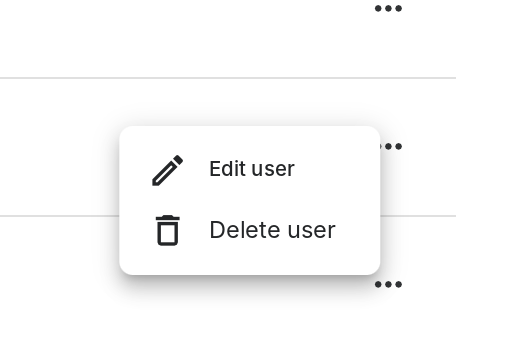
Menu (…) per user
Edit user: change name, role and contact information. Delete user: remove the user's access.

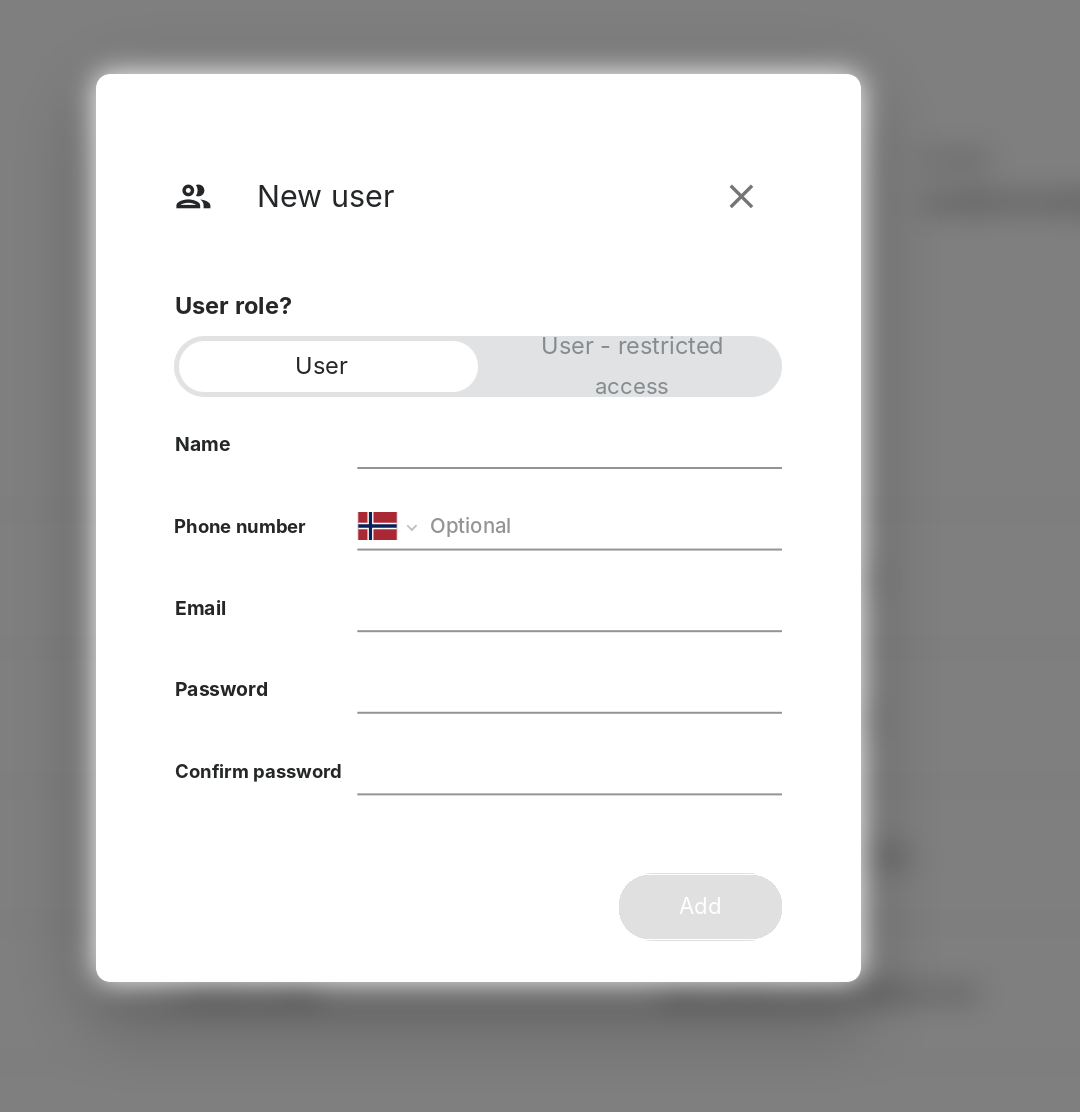
Step by step: Add a new user
- Go to Users and click New user.
- Choose a role: User or User – restricted access.
- Enter name, email and password, and optionally a phone number.
- Click Add.
- Give the email address and password to the new user. The user can change the password afterwards.